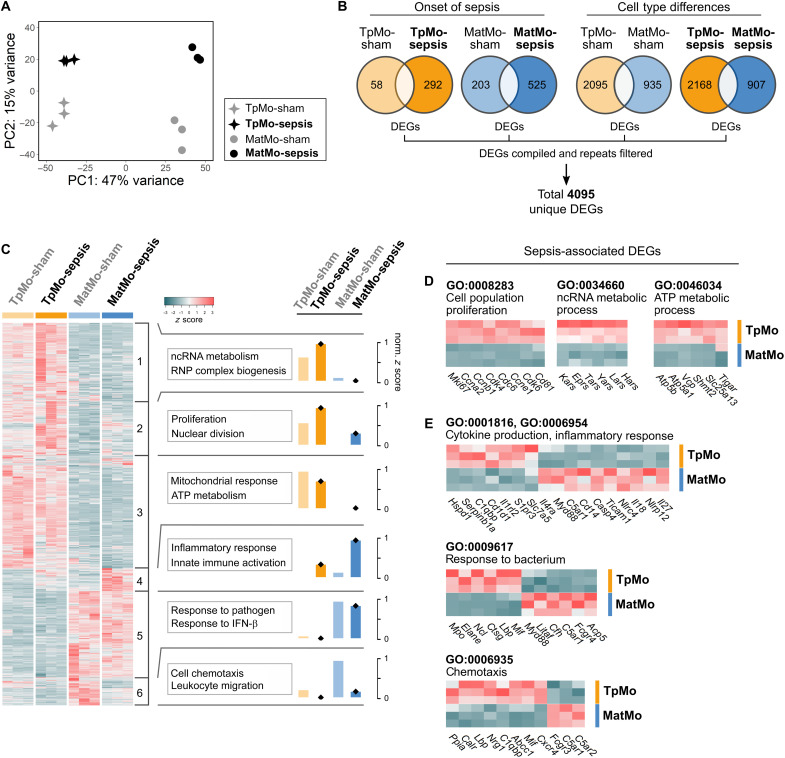
Fig. 4. TpMos express distinct effector genes from MatMos in response to sepsis.
(A to E) TpMos and MatMos from sham and CLP-induced sepsis conditions on day 6 were sorted from the BM. (A) PCA of bulk RNA-seq data for BM TpMo and MatMo subsets across sham and sepsis conditions; TpMo-sepsis (black star, top left), MatMo-sepsis (black circle, top right), TpMo-sham (gray star, bottom left), and MatMo-sham (gray circle, bottom right). (B) Venn diagrams representing DEGs (up/down) between BM TpMo and MatMo subsets across sham and sepsis conditions; TpMo-sham (pale orange), TpMo-sepsis (orange), MatMo-sham (pale blue), and MatMo-sepsis (blue). All DEGs identified across four conditions were merged, and repetitive genes were excluded to obtain 4095 unique DEGs for gene expression analysis. (C) Heatmap of unique DEGs expression across subsets represented as z score. Gene clusters (1 to 6) were obtained by unsupervised k-means clustering and subjected to GO biological process enrichment analysis. Functional characterization of gene clusters was based on the top five GO terms obtained from analysis. Functional scores for each gene cluster across conditions were represented as normalized z score. RNP, ribonucleoprotein. (D) Cell population proliferation, ncRNA metabolic process, and ATP metabolic process (left to right) related gene expression between BM TpMo and MatMo subsets during sepsis. (E) Cytokine production/inflammatory response, response to bacterium, and chemotaxis (top to bottom) related gene expression between BM TpMo and MatMo subsets during sepsis.

