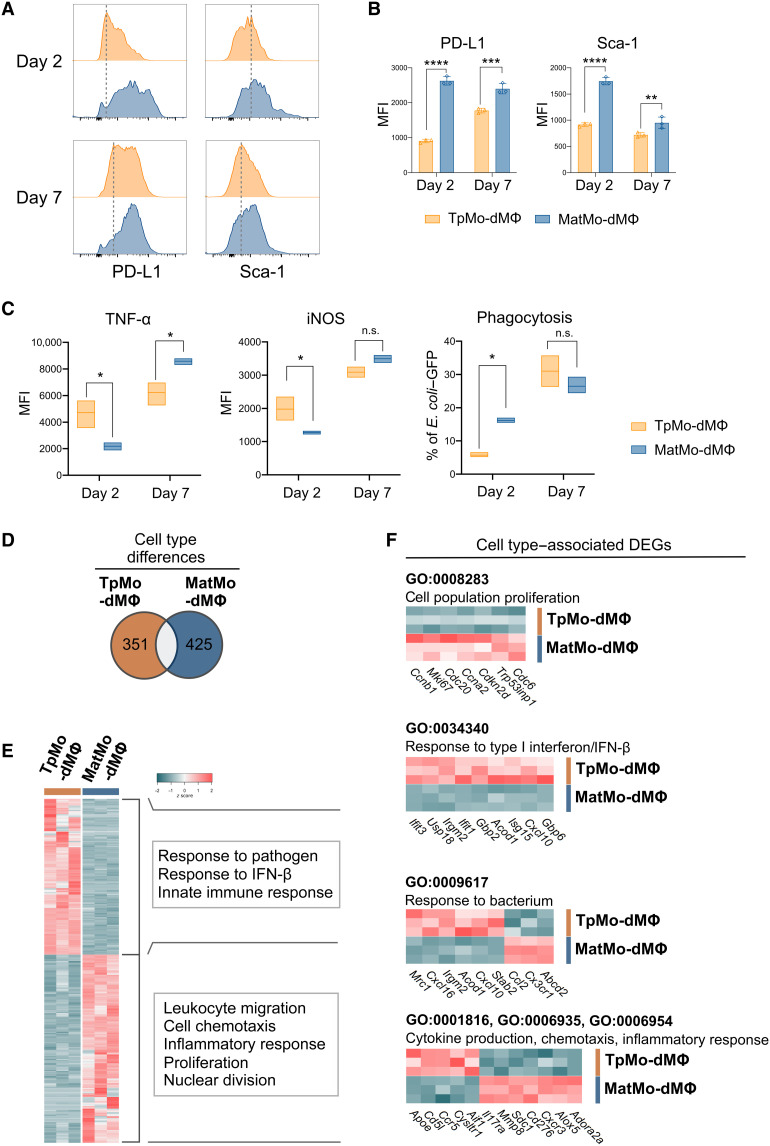
Fig. 6. TpMo-dMΦs are distinct from MatMo-dMΦs.
(A to C) TpMos and MatMos were cultured with CSF-1 (20 ng/ml) and analyzed at 2 or 7 days after culture for surface markers (A) with median fluorescence intensity (MFI) quantified (B) or incubated with E. coli–GFP for 3 hours before TNF-α and iNOS expression, as well as phagocytosis of E. coli–GFP, was quantified (C). Results are expressed as means ± SD and representative of one of three experiments. *P < 0.05, **P < 0.01, ***P < 0.001, and ****P < 0.0001 (Student’s t test). (D to F) TpMo-dMΦs and MatMo-dMΦs 7 days after culture were analyzed by RNA-seq. (D) Venn diagram representing 776 DEGs between TpMo-dMΦ and MatMo-dMΦ subsets. (E) Heatmap of unique DEGs expression across subsets represented as z score. DEGs were subjected to GO biological process enrichment analysis. Functional characterization of DEGs was based on the top five GO terms obtained from analysis. (F) Cell population proliferation, response to type I interferon/IFN-β, response to bacterium, and cytokine production/chemotaxis/inflammatory response (top to bottom) related gene expression between TpMo-dMΦ and MatMo-dMΦ subsets.

