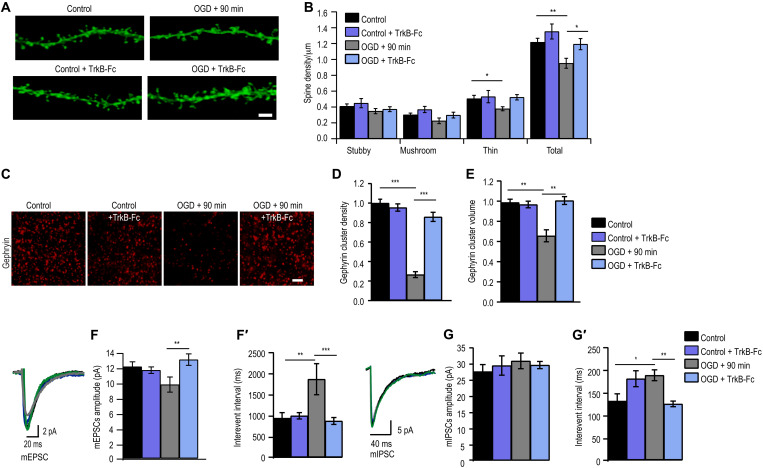
Fig. 2. Scavenging BDNF rescues OGD-induced synapse deficits.
(A) Example dendrites from CA1 neurons expressing myristoylated-eGFP with and without TrkB-fc treatment. Scale bar, 2 μm. (B) Quantification of dendritic spines [*P < 0.05, **P < 0.01, two-way analysis of variance (ANOVA) with Bonferroni multiple comparison test]. Total spine density (spines per micrometer of dendrite): Control, 1.22 ± 0.05 (n = 16); Control + TrkB-Fc, 1.40 ± 0.10 (n = 12); OGD, 0.95 ± 0.06 (n = 12); OGD + TrkB-Fc, 1.19 ± 0.07 (n = 14). (C) Example images of maximum intensity projections of organotypic hippocampal slices immunostained for gephyrin with and without TrkB-Fc treatment. Scale bar, 2 μm. (D) Quantification of number of gephyrin puncta per confocal stack (consisting of five 512 pixel–by–512 pixel z planes each; ***P < 0.001, two-way ANOVA with Bonferroni multiple comparison test; all gephyrin values were normalized to control). Mean number (A.U.): Control, 1.00 ± 0.04 (n = 15); Control + TrkB-Fc, 0.95 ± 0.04 (n = 9 slices); OGD, 0.27 ± 0.03 (n = 13); OGD + TrkB-Fc, 0.86 ± 0.05 (n = 13). (E) Quantification of gephyrin puncta volume (**P < 0.01, two-way ANOVA with Bonferroni multiple comparison test). Mean volume (A.U.): Control, 1.00 ± 0.03; Control + TrkB-Fc, 0.98 ± 0.03; OGD, 0.67 ± 0.06; OGD + TrkB-Fc, 1.02 ± 0.04. Data are shown as means ± SD (n = 30 cells). (F) Cumulative probability histogram of mean amplitude (**P < 0.01, two-way ANOVA with Bonferroni multiple comparison test). (F′) Cumulative probability histogram for IEIs of mEPSCs (**P < 0.01, ***P < 0.001, two-way ANOVA with Bonferroni multiple comparison test). (G) Cumulative probability histogram of mean amplitude of mIPSCs (P < 0.05 two-way ANOVA with Bonferroni multiple comparison test). (G′) Cumulative probability histogram for IEIs of mIPSCs (*P < 0.05, **P < 0.01, two-way ANOVA with Bonferroni multiple comparison test). Data are shown as means ± SD.

