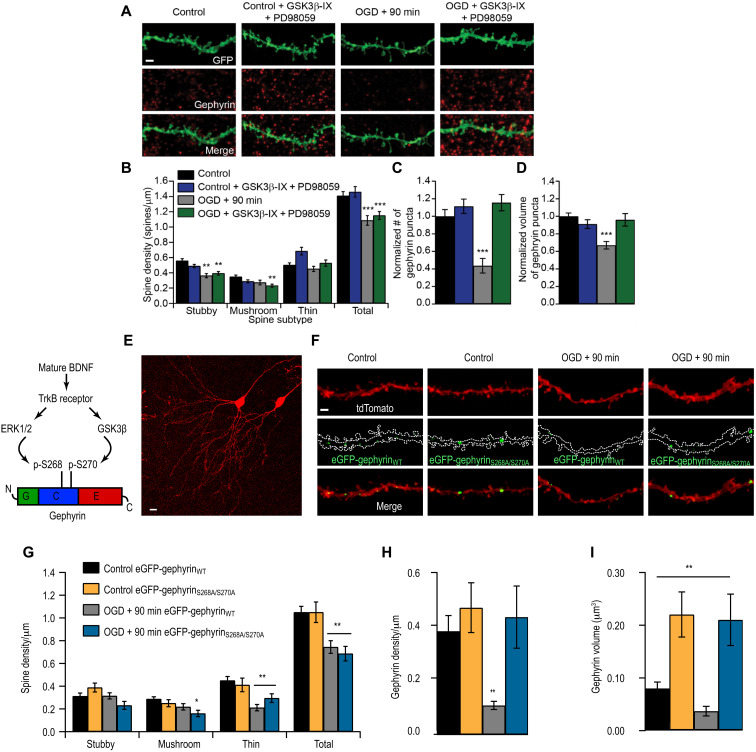
Fig. 4. ERK1/2 and GSK3β pathways induce gephyrin degradation but not dendritic spine loss after OGD.
(A) Example CA1 tertiary dendrites from control and 90 min after OGD slices, immunostained for gephyrin, with or without GSK3β-IX and PD98059. Scale bar, 2 μm. (B) Spine quantification (**P < 0.01, ***P < 0.001). Total spine density (spines per micrometer): Control, 1.41 ± 0.06; Control + PD + G.-IX, 1.46 ± 0.07; OGD, 1.09 ± 0.06; OGD + PD + G.-IX, 1.15 ± 0.05. (C) Quantification of gephyrin cluster density (***P < 0.001). (D) Quantification of gephyrin cluster volume. Mean number (A.U.): Control, 1.00 ± 0.08; Control + PD + G.-IX, 1.12 ± 0.08; OGD, 0.44 ± 0.08; OGD + PD + G.-IX, 1.16 ± 0.09 (***P < 0.001). Mean volume (A.U.): Control, 1.00 ± 0.04; Control + PD + G.-IX, 0.91 ± 0.05; OGD, 0.67 ± 0.04; OGD + PD + G.-IX, 0.96 ± 0.07. (E) Example CA1 pyramidal neurons biolistically transfected with tdTomato and gephyrin. Scale bar, 10 μm. (F) CA1 tertiary dendrites from control and 90 min after OGD slices transfected with either eGFP-gephyrinWT or eGFP-gephyrinS268A/S270A. (G) Spine quantification (*P < 0.05, **P < 0.01). Total spine density (spines per micrometer): Control + gephyrinWT-GFP, 1.05 ± 0.052; Control + eGFP-gephyrinS268A/S270A, 1.05 ± 0.090; OGD, eGFP-gephyrinWT 0.74 ± 0.056; OGD + eGFP-gephyrinS268A/S270A, 0.69 ± 0.064. (H) Gephyrin cluster density (**P < 0.01). Density: Control + eGFP-gephyrinWT, 0.38 ± 0.58; Control + eGFP-gephyrinS268A/S270A, 0.47 ± 0.092; OGD + eGFP-gephyrinWT, 0.11 ± 0.015; OGD+ eGFP-gephyrinS268A/S270A, 0.44 ± 0.12. (I) Gephyrin cluster volume (**P < 0.01). Mean volume: Control + eGFP-gephyrinWT, 0. 85 ± 0.012; Control + eGFP-gephyrinS268A/S270A, 0.22 ± 0.043; OGD + eGFP-gephyrinWT, 0.046 ± 0.01; OGD+ eGFP-gephyrinS268A/S270A, 0.21 ± 0.049. Data are shown as means ± SD. Two-way ANOVA with Bonferroni multiple comparison test. n = 18 slices.

