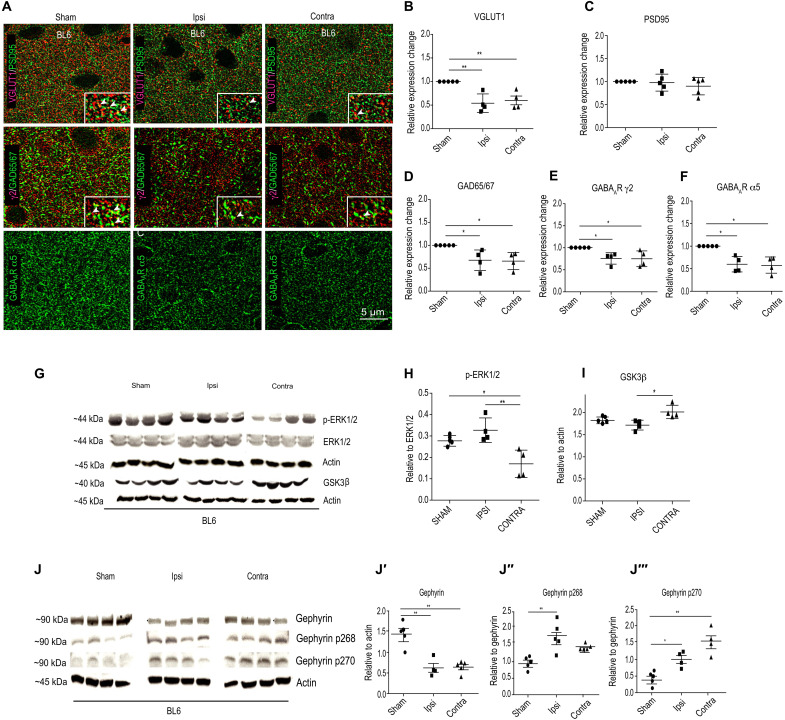
Fig. 5. Synapse changes in the peri-infarct area of ipsilateral hemispheres 24 hours following MCAO.
(A) Example composite images for glutamatergic synaptic proteins (VGLUT1 and PSD95) and GABAergic synaptic markers (GAD65/67, GABAAR γ2, and GABAAR α5). (B) Quantification for VGLUT1 cluster density [one-way ANOVA, Bonferroni multiple comparison post hoc test; F2,49 = 11.2; **P < 0.01]. (C) Quantification for PSD95 cluster density [one-way ANOVA, Bonferroni multiple comparison post hoc test; F2,49 = 0.84; P = 0.43]. (D to F) Quantification for GAD65/67 [one-way ANOVA, Bonferroni multiple comparison post hoc test; F2,10 = 7.9; P = 0.0085], GABAAR γ2 [one-way ANOVA, Bonferroni multiple comparison post hoc test; F2,9 = 6.4; P = 0.018], and GABAAR α5 cluster density (one-way ANOVA, Bonferroni multiple comparison test; F2,9 = 8.3; P = 0.0088). Data are shown as means ± SD (n = 5 animals); *P < 0.05. (G to I) WB analysis for phospho-ERK1/2, total ERK1/2, GSK3β, and actin in sham and 24 hours after MCAO samples. *P < 0.05, **P < 0.01. (J to J‴) WB analysis for total gephyrin, phospho-gephyrin at Ser268 (gephyrin p268), and phospho-gephyrin at Ser270 (gephyrin p270) levels in BL6 WT sham and 24 hours after MCAO mice. *P < 0.05, **P < 0.01. Data are shown as means ± SD (n = 4 animals).

