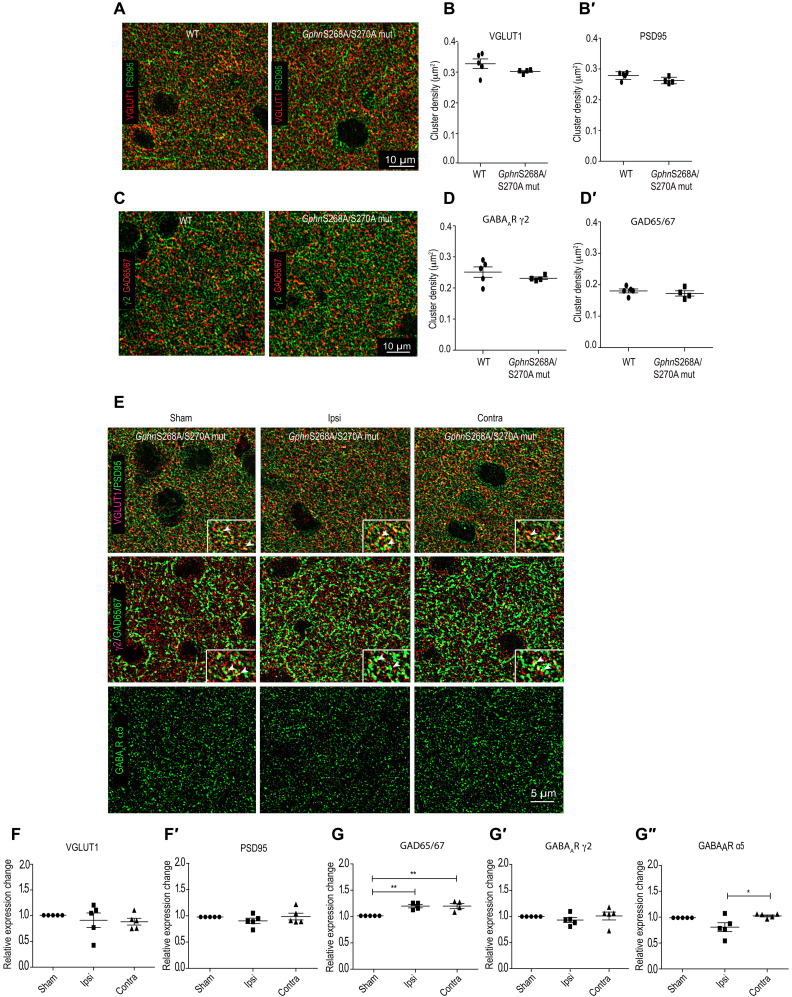
Fig. 6. Synapse loss is attenuated in GphnS268A/S270A mutant mice 24 hours following MCAO.
(A) Example images of immunohistochemical staining for glutamatergic synapse marker proteins from motor cortex L2/3 ipsi- and contralateral sides in WT and GphnS268A/S270A mutant mice. (B and B′) Quantification of VGLUT1 and PSD95 cluster density per square micrometer. (C) Example images of immunohistochemical staining for GABAergic synapse marker proteins from motor cortex L2/3 ipsi- and contralateral sides in WT and GphnS268A/S270A mutant mice. (D and D′) Quantification of GABAAR γ2 subunit and GAD65/67 cluster density per square micrometer. (E) Example images of immunohistochemical staining for glutamatergic and GABAergic synaptic proteins in GphnS268A/S270A mutant mice 24 hours following MCAO. Glutamatergic synaptic terminals were visualized using VGLUT1 and PSD95 (see insets). GABAergic synaptic sites were visualized using GAD65/67, GABAAR γ2, and GABAAR α5. (F) Quantification for VGLUT1 [one-way ANOVA, Brown-Forsythe test; F2,11 = 0.35; P = 0.70]. (F′) Quantification of PSD95 cluster density [one-way ANOVA, Brown-Forsythe test; F2,11 = 1.03; P = 0.38]. (G) Quantification for GAD65/67 [one-way ANOVA, Bonferroni multiple comparison test; F2,9 = 11.9; P = 0.003]. **P < 0.01. (G′) Quantification of GABAAR γ2 [one-way ANOVA, Bonferroni multiple comparison test; F2,11 = 0.60; P = 0.56]. (G″) Quantification of GABAAR α5 clusters [one-way ANOVA, Bonferroni multiple comparison test; F2,11 = 4.9; P = 0.02]. *P < 0.05. Data are shown as means ± SD (n = 5 animals).

