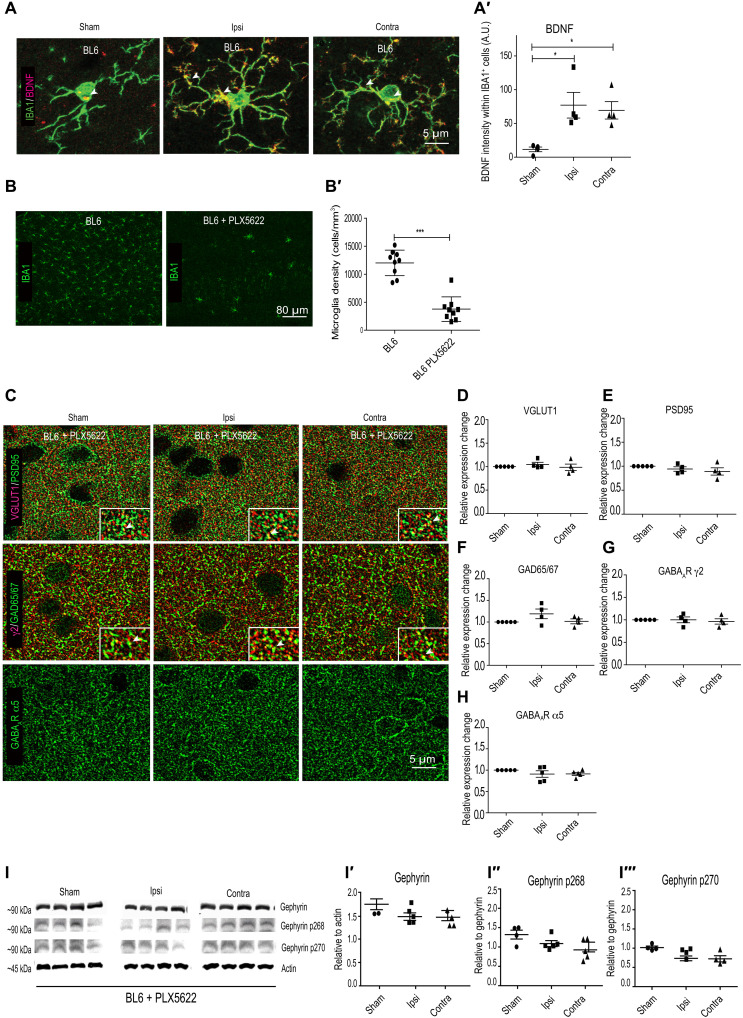
Fig. 7. Microglia depletion stabilizes synapse changes after OGD.
(A) BDNF expression within microglia in BL6 WT sham and MCAO animals. (A′) Quantification of BDNF intensity within IBA1-positive cells. *P < 0.05. (B) Example images from BL6 WT mice treated with PLX5622 sham and MCAO. (B′) Microglia depletion after PLX5622 chow treatment for 7 days (chow, 1200 mg/kg). ***P < 0.001. (C) Example images from BL6 WT PLX5622-treated MCAO animals, quantified for (D and E) VGLUT1 and PSD95 and (F to H) GAD65/67, GABAAR γ2, and GABAAR α5 expression changes relative to sham in BL6 WT PLX5622-treated MCAO animals. (I) WB analysis for total gephyrin, phospho-gephyrin at Ser268, and phospho-gephyrin at Ser270 levels in BL6 WT mice treated with PLX5622 at 24 hours after MCAO. (I′ to I‴) Quantification of WB for total gephyrin, phospho-gephyrin at Ser268 and phospho-gephyrin at Ser270 levels in BL6 WT mice treated with PLX5622 at 24 hours after MCAO. Quantification expressed as means ± SD (n = 5); P > 0.05 (one-way ANOVA, Bonferroni multiple comparison test).

