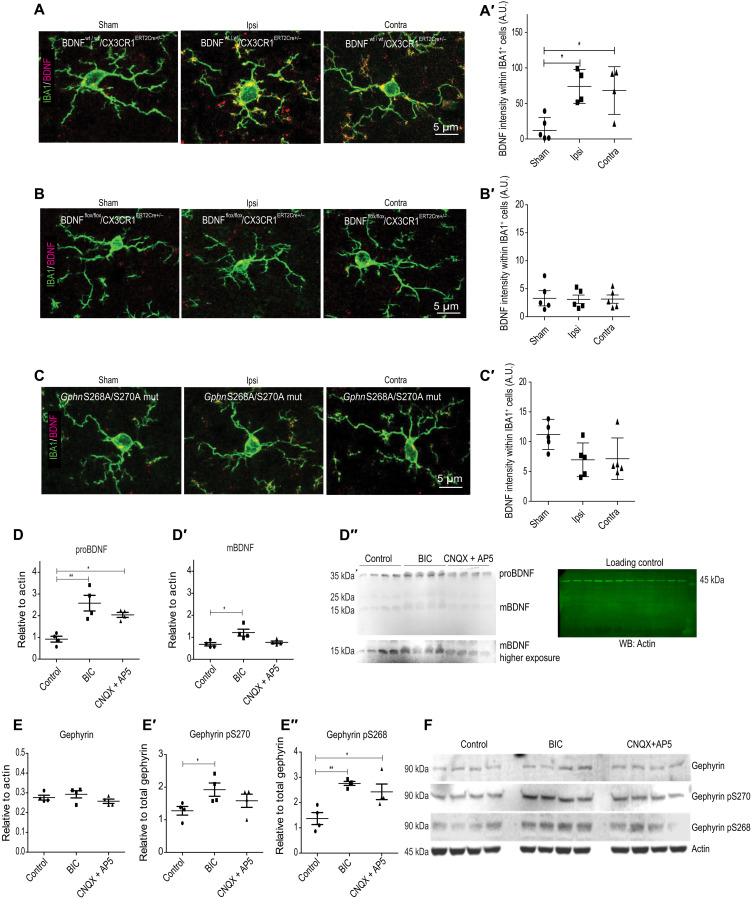
Fig. 9. GphnS268A/S270A mutation affects BDNF levels in microglia after MCAO.
(A) Example images from BDNFwt/wt/CX3CR1ERT2Cre+/− mice stained from sham or 24 hours after MCAO tissue for microglia markers IBA1 and BDNF (composite shown). (A′) Quantification for BDNF intensity within IBA1-positive cells in BDNFwt/wt/CX3CR1ERT2Cre+/− sham animals and ipsi- and contralateral sides of MCAO animals. *P < 0.05. (B) Example images from BDNFflox/flox/CX3CR1ERT2Cre+/− mice stained from sham or 24 hours after MCAO tissue for microglia markers IBA1 and BDNF. (B′) Quantification for BDNF intensity within IBA1-positive cells in BDNFflox/flox/CX3CR1ERT2Cre+/− sham animals and ipsi- and contralateral sides of MCAO animals. (C) Example images from GphnS268A/S270A mutant sham animals and ipsi- and contralateral sides of MCAO animals. (C′) Quantification for BDNF intensity within IBA1-positive cells in GphnS268A/S270A mutant sham animals and ipsi- and contralateral sides of MCAO animals. (D to D″) WB analysis for proBDNF and mBDNF in BV2 microglia cell line after treatment with BIC (20 μM) or CNQX (20 μM) + AP5 (100 μM) for 90 min. Blots with protein bands and actin loading control are shown on the right. *P < 0.05, **P < 0.01. (E to E″) WB analysis for total gephyrin, phospho-gephyrin at Ser268, and phospho-gephyrin Ser270 in BV2 microglia cell line after treatment with BIC (20 μM) or CNQX (20 μM) + AP5 (100 μM) for 90 min. *P < 0.05, **P < 0.01. (F) Blots showing the gephyrin protein bands and actin loading control (n = 4); *P < 0.05 (one-way ANOVA, Bonferroni multiple comparison test).

