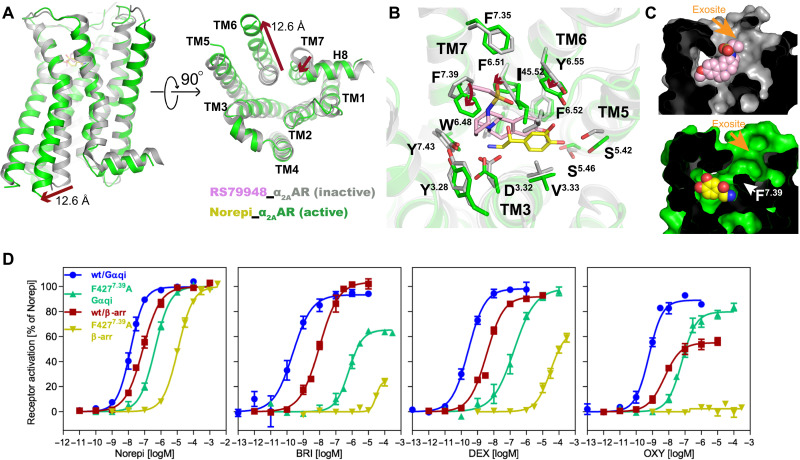
Fig. 5. Comparison of inactive and active α2AAR.
(A) Structural comparison of inactive α2AAR bound to RS79948 and active α2AAR bound to Norepi, with changes highlighted as red arrows. The distance is calculated between positions of Cα of residue 6.29 in TM6. (B) Conformational changes within the orthosteric pocket are shown from the extracellular side, with changes highlighted as red arrows. (C) Cross sections of α2AAR bound to antagonist and agonist are shown, with the interior in black and the exosite highlighted. (D) Concentration-response curves of F4277.39 mutant for different agonists toward G protein activation and β-arrestin-2 recruitment. Data are presented as means ± SEM of 4 to 10 independent experiments with repeats in duplicate.

