. 2022 Jan-Mar;26(1):e2021.00074. doi: 10.4293/JSLS.2021.00074
© 2022 by SLS, Society of Laparoscopic & Robotic Surgeons.
This is an Open Access article distributed under the terms of the Creative Commons Attribution Non-Commercial No Derivatives License (http://creativecommons.org/licenses/by-nc-nd/3.0/us/), which permits for noncommercial use, distribution, and reproduction in any medium, provided the original work is properly cited and is not altered in any way.
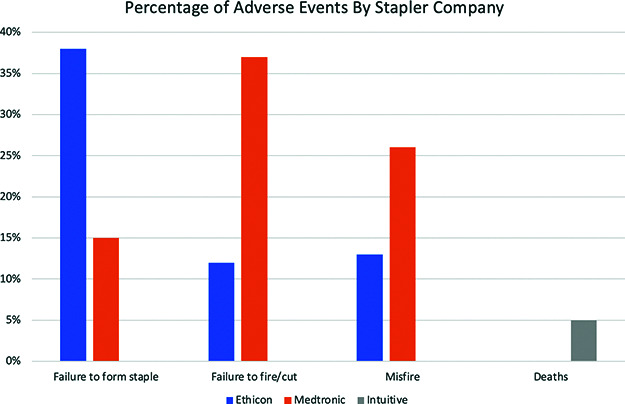
Figure 1.

Bar graph of the most common adverse events by manufacturer.
