. 2022 Feb 23;11:e69082. doi: 10.7554/eLife.69082

Figure 4. Acute inhibition of actomyosin contractility results in stage-dependent response during ventral furrow formation.

(a) Still images from multiphoton movies showing different tissue responses to acute loss of myosin contractility during ventral furrow formation. Early Group, Mid Group, and Late Group embryos (N=8, 4, and 6 embryos, respectively) are defined based on their immediate response to myosin inhibition. For stimulated embryos, the first frame corresponds to the time point immediately after stimulation. The inset depicts the stimulation and imaging protocol. Arrowheads indicate the apex of the ventral most cells. (b) Time evolution of the invagination depth ‘D’ for the stimulated embryos and a representative unstimulated control embryo. For stimulated embryos, all movies were aligned in time to the representative control embryo based on furrow morphology at the time of stimulation. (c) Relationship between the transition phase for sensitivity to myosin inhibition (Ttrans) and lengthening-shortening transition (TL-S trans). (d) Scatter plot showing the relation between invagination depth at the time of stimulation (Ds) and the delay time (Tdelay) in furrow invagination compared to the representative control embryo. Tdelay is highly sensitive to Ds, with a switch-like change at Ds~6 μm (dashed line). Inset: Average Tdelay in Early (E, n=5 embryos that invaginated), Mid (M, n=4), and Late (L, n=6) Group embryos. Statistical comparisons were performed using two-sided Wilcoxon rank-sum test. (e) Cartoon depicting mechanical bistability of the mesoderm during gastrulation. Both the initial, pre-constriction state and the final, fully invaginated state are stable. During gastrulation, actomyosin contractility is critical for bringing the system from the initial state to an intermediate, transitional state, whereas the subsequent transition to the final state can occur independent of myosin contractility.

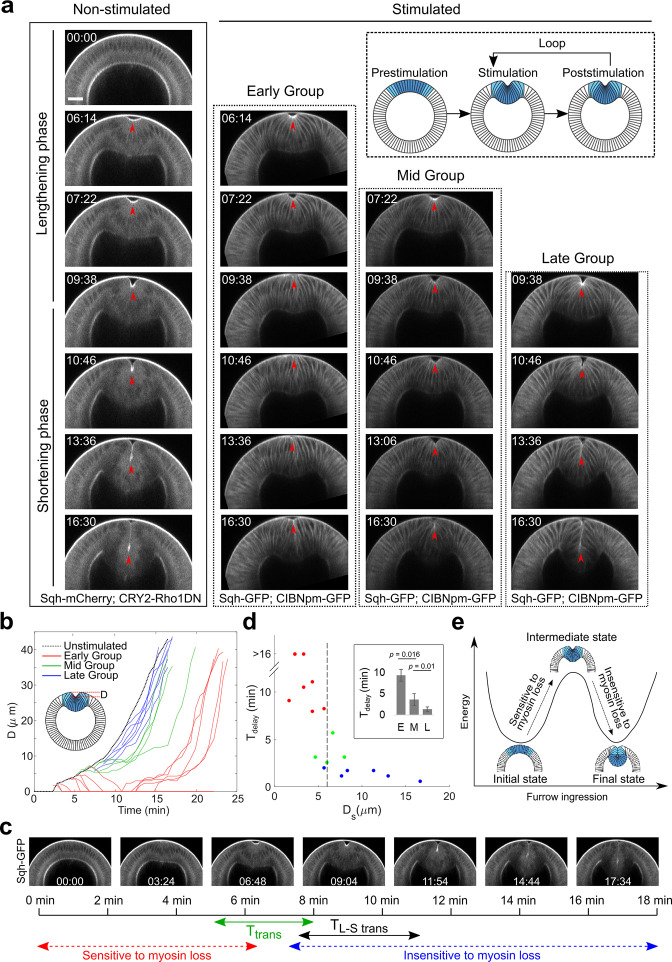
Figure 4—source data 1. Cell length measurements for determining lengthening-shortening transition time.

Figure 4.

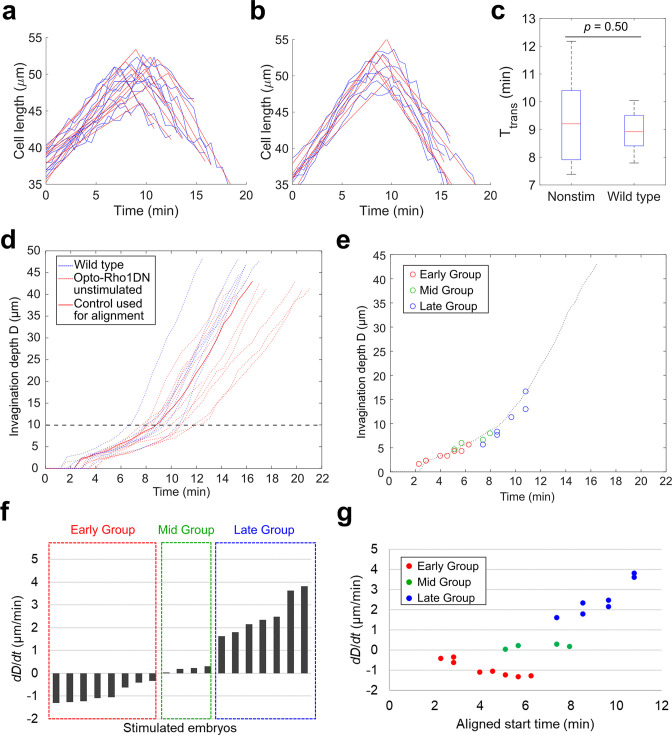
Figure 4—figure supplement 1. Classification of the response of embryos to acute myosin inhibition during ventral furrow formation.

Figure 4—figure supplement 1.

(a–c) Determining the transition point between the lengthening and shortening phases (TL-S trans). (a, b) Measurement of apical-basal cell length of the ventral most cells over the course of ventral furrow formation in unstimulated control embryos that express Opto-Rho1DN (a, unstimulated control, N=10) and wild-type embryos that do not express Opto-Rho1DN (b, wild-type, N=6). For each group, one obvious outlier was excluded from the analysis. The raw measurement for each embryo (blue) is fitted with two intersecting line segments (red) to determine TL-S trans. The distribution of TL-S trans for unstimulated control embryos and wild-type embryos is shown in (c). There is no significant difference between the two control groups (Student’s t-test). Error bars: s.d. (d) Measurement of invagination depth D in unstimulated control embryos (red dotted lines) and wild-type embryos (blue dotted lines). Red solid line marks the representative unstimulated control embryo used for time alignment of the stimulated embryos. Black dashed line indicates the average invagination depth at TL-S trans. (e) Alignment of the stimulated embryos to the representative control embryo (dotted line) based on furrow morphology immediately before stimulation. Each open circle shows the invagination depth D of a stimulated embryo at the aligned starting time. (f) The average rate of invagination within the first 4 min immediately after stimulation (dD/dt) is used to categorize the stimulated embryos into three groups. Early Group: dD/dt<–0.3 μm/min; Mid Group: dD/dt is between –0.3 μm/min and 0.3 μm/min; and Late Group: dD/dt>0.3 μm/min. (g) dD/dt as a function of aligned starting time as defined in (e). Note that there is no positive correlation between dD/dt and the stage of stimulation among Early Group or Mid Group embryos.
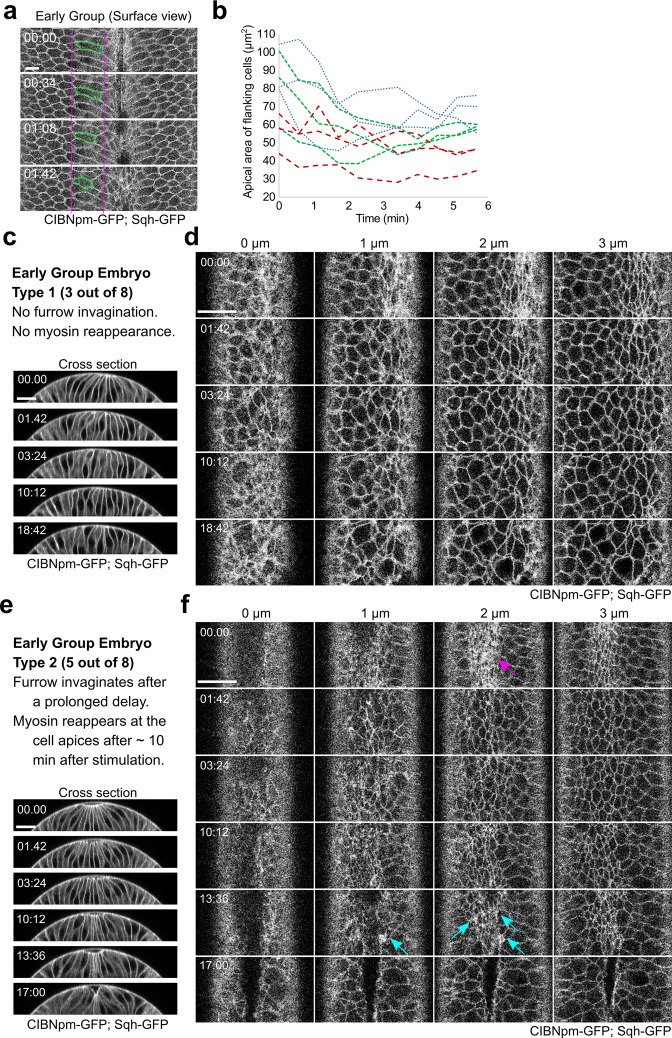
Figure 4—figure supplement 2. Tissue response to acute myosin inhibition in Early Group embryos.

Figure 4—figure supplement 2.

(a) Surface view of a representative Early Group embryo showing elastic recoil of apical domain of the flanking non-constricting cells upon activation of Opto-Rho1DN. During apical constriction, the apical domain of the flanking non-constricting cells is stretched by the ventral constricting cells. Upon myosin inhibition, the stretched apical domain relaxes back. One example cell is marked in green. Scale bar: 10 μm. (b) Quantification of apical domain size of the flanking non-constricting cells in three Early Group embryos after stimulation, with three cells measured in each embryo. (c, d) A representative Early Group embryo that remains at the non-constricted configuration after apical relaxation (Early Group Type 1, three out of eight embryos). Images show a combined signal from CIBNpm-GFP (cell membrane) and Sqh-GFP (medial apical). After the initial relaxation of the apical domain, the apical cell area becomes progressively heterogeneous, but no net apical constriction occurs. Ventral cells remain at the surface of the embryo without forming a furrow. (e, f) A representative Early Group embryo that undergoes ventral furrow invagination after a prolonged delay (Early Group Type 2, five out of eight embryos). In these embryos, Sqh-GFP partially reaccumulates at the cell apices, which becomes obvious approximately 10 min after the first stimulation (cyan arrows in (f)). The reaccumulated myosin has a lower level and more heterogeneous distribution compared to the same embryo before stimulation (magenta arrow in (f)). Nevertheless, accompanying with the reaccumulation of apical myosin, the ventral cells invaginate and form a ventral furrow. Scale bars: 20 μm. In all panels, time zero corresponds to the time of first stimulation.
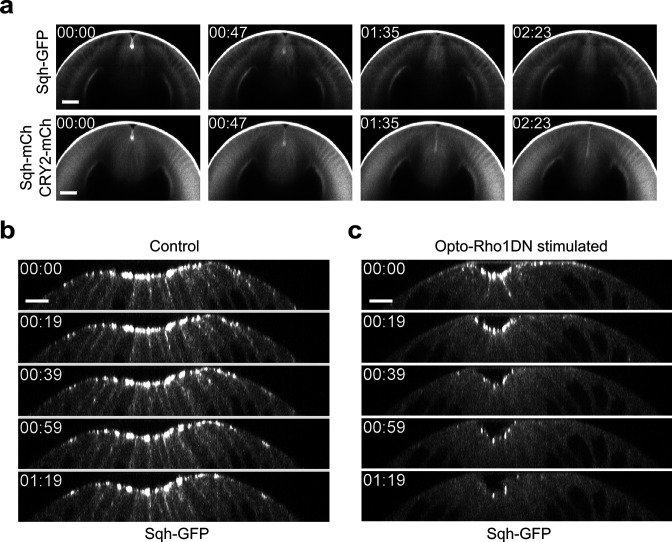
Figure 4—figure supplement 3. Dissociation of myosin from both apical and lateral cell cortices in constricting cells upon Opto-Rho1DN stimulation.

Figure 4—figure supplement 3.

(a) Cross-section views of a representative Late Group embryo showing prompt dissociation of apical myosin from the apical cortex (N=4 embryos). The embryo expresses CIBNpm instead of CIBNpm-GFP to allow better visualization of Sqh-GFP. Sqh-GFP is accumulated at the apical cortices before stimulation but disappears from the apical cortices in less than 1.6 min. Sqh-mCherry and mCherry-tagged CRY2-Rho1DN signals in the same embryo are shown at the lower panel for comparison. Time zero corresponds to the time of stimulation. Scale bars: 20 μm. (b, c) Cross-section views of a control embryo expressing Sqh-GFP and CIBNpm (b) and an embryo expressing Sqh-GFP, CIBNpm, and CRY2-Rho1DN (c). In control embryos, lateral myosin appears during apical constriction and can always be detected as constriction proceeds (N=8 embryos). In contrast, in embryos expressing Opto-Rho1DN, lateral myosin disappears within 20 s after stimulation, faster than the loss of apical myosin (N=6 embryos). Scale bars: 10 μm.
Figure 4—video 1. Stage-dependent response to acute myosin inhibition during ventral furrow formation.
Download video file (1MB, mp4)
In Early Group embryos, the apically constricting cells relax immediately as myosin dissociates from the cortex, causing the disappearance of the initial apical indentation. In Mid Group embryos, no obvious relaxation occurs, but ventral furrow invagination is paused for approximately 5 min before invagination resumes. In Late Group embryos, furrow invagination proceeds at a normal speed without obvious pause or tissue relaxation after stimulation. In all cases, apical myosin disappears 60–90 s after stimulation.