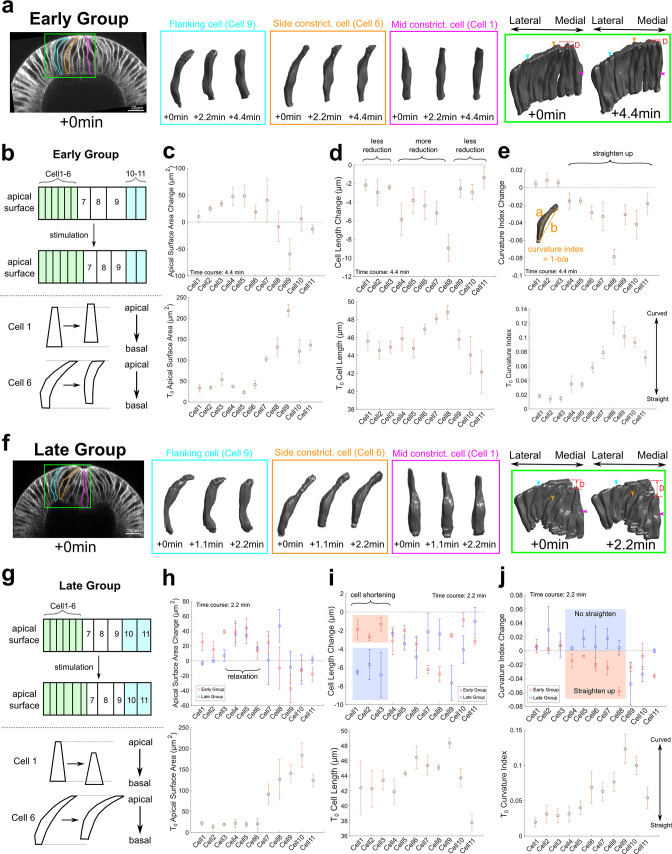
Figure 5. Three-dimensional segmentation reveals details of cell response after Opto-Rho1DN stimulation.
(a–e) Early Group embryos and (f–j) Late Group embryos. (a, f) A row of cells along the medial-lateral axis on one side of the ventral midline was segmented in 3D (green box) over time after stimulation. Cells 1–6: constricting cells; Cells 7–9: flanking cells; Cells 10 and 11: ectodermal cells. Early Group: T=0, 2.2, and 4.4 min. Late Group: T=0, 1.1, and 2.2 min. 3D rendering of three representative cells, cell 1 (mid constricting cell), cell 6 (side constricting cell), and cell 9 (flanking cell), are shown in magenta, orange, and cyan boxes, respectively. These cells are also marked on the cross-section views (outlines) and the 3D tissue renderings (arrowheads) with the same color code. D: invagination depth. (b, g) Cartoon depicting apical surface area change (top) and characteristic cell shape changes (bottom) observed in Early Group (b) and Late Group (g) embryos. (c–e, h–j) Upper panels: quantifications showing the apical surface area change (c, h), cell length change (d, i), and cell curvature change (e, j) between 0 and 4.4 min (c–e) or between 0 and 2.2 min (h–j). Measurements from both Early and Late Groups are shown in (h-j) for comparison. Bottom panels show the measurements for each quantity immediately after stimulation (T=0). Error bars: ±s.e. N=3 embryos for each group.


