. 2022 Feb 23;11:e69082. doi: 10.7554/eLife.69082

Figure 8. The lateral ectoderm undergoes apical-basal shortening during gastrulation independently of ventral furrow formation.

(a) Top: cartoon showing a cross-section view of an embryo. Blue: mesoderm. Yellow: segmented ectoderm region (ROI). Green: the same group of ectoderm cells. The ROI (in 3D) covers the lateral ectodermal region that is 60°–120° away from the ventral midline and 75-μm long along the AP axis. The change in the volume of ROI (Volec) is used as a readout for change in average tissue thickness. Bottom: representative segmented 3D views showing the ectoderm at the onset of apical constriction (T0), reaches the thickest point (Tpeak) and at the last time frame of ventral furrow formation that is reliably segmented (Tend). (b) Definition for the direction of cell movement used in (c–f). (c, d) Change in Volec over time and cell movement along A-P and D-V axis in wild-type (c) and snail mutant embryos (d). Arrowheads indicate the start of ectoderm shortening. (e) Cell movement along A-P and D-V axis in wild-type and snail mutants are replotted together for better comparison. (f) Change in Volec and invagination depth D over time in wild-type and snail mutant embryos. Arrowheads indicate the start of ectoderm shortening. (g) Representative cross-section views showing the wild-type and snail mutant embryos at T0, Tpeak, and Tend, respectively. Arrowheads indicate the apex of the mid constricting cells. N=3 embryos for each genotype. Scale bars: 20 μm. (h) Comparison of the ectoderm volume reduction rate between the wild-type and snail mutant embryos. The descending part of the volume curve was fitted into a straight line to calculate the rate of volume reduction.

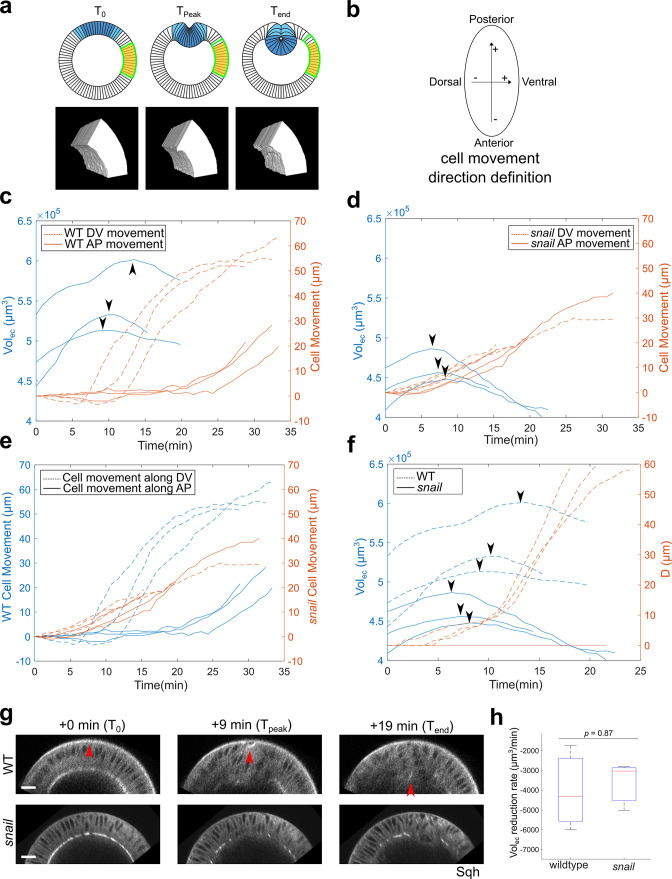
Figure 8.

Figure 8—figure supplement 1. Lateral ectoderm undergoes apical-basal shortening during ventral furrow formation.

Figure 8—figure supplement 1.

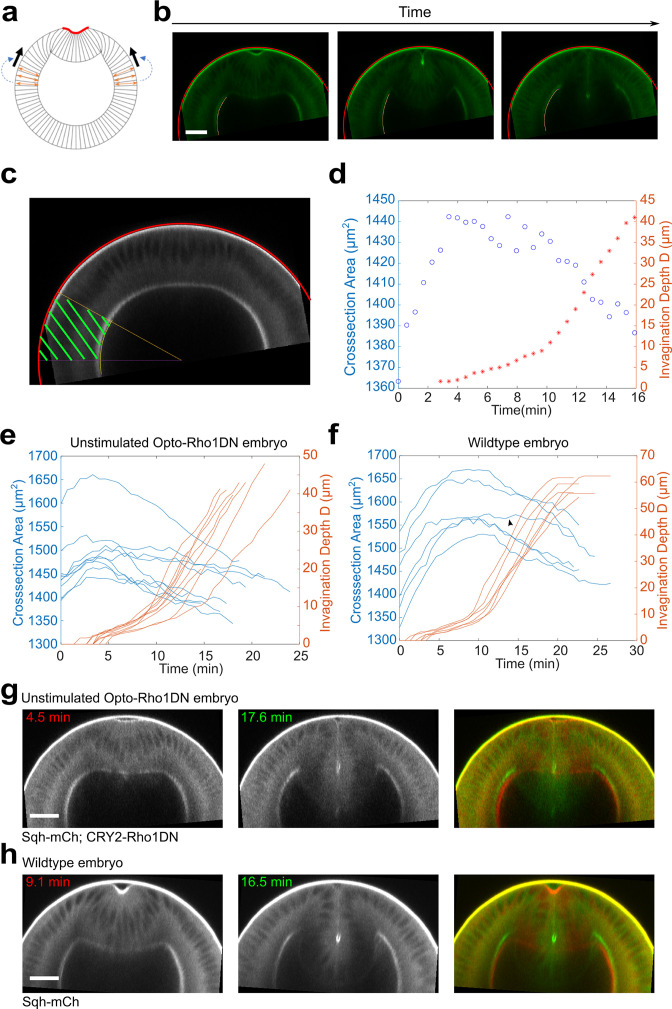
(a) Cartoon depicting a possible link between ectodermal shortening and the generation of compressive stress. Because the cytoplasm is non-compressible, apical basal shortening of the ectodermal cells could lead to cell expansion in the planar direction, thereby generating in-plane compression that facilitates mesoderm invagination. (b) Images show the tracked apical (red) and basal (yellow) surfaces of the lateral ectoderm during furrow formation. (c) The ectodermal region in the cross-section view between 60° and 90° from the ventral midline was selected for area measurement (‘cross-section area,’ green shaded region). (d) Relationship between ectodermal tissue area and invagination depth D in a representative unstimulated Opto-Rho1DN embryo. Ectodermal tissue shortening happens prior to TL-S trans. T=0 min represents the onset of apical constriction. (e, f) Time evolution of the invagination depth D (orange lines) and the cross-section area of the lateral ectodermal tissue (blue lines) measured in unstimulated Opto-Rho1DN embryos ((e), N=9 embryos) and in wild-type embryos expressing Ecad-GFP and Sqh-mCherry ((f), N=6 embryos). In unstimulated Opto-Rho1DN embryos, the onset of ectodermal shortening is consistently earlier than TL-S trans. A similar trend is observed in most (five out of six) wild-type embryos, although the onset of ectodermal shortening was overall closer to TL-S trans in this background. In one out of six wild-type embryos, ectodermal shortening only became obvious at a late stage of furrow invagination (arrowheads in (f)). (g, h) Cross-section views of representative unstimulated Opto-Rho1DN embryo (g) and wild-type embryo (h) at early and late stages of furrow formation. Overlayed images highlight the reduction of ectodermal thickness. Scale bars: 25 μm.
Figure 8—figure supplement 2. The impact of altering the extent of ectodermal shortening on the response of the model to acute myosin inhibition.

Figure 8—figure supplement 2.

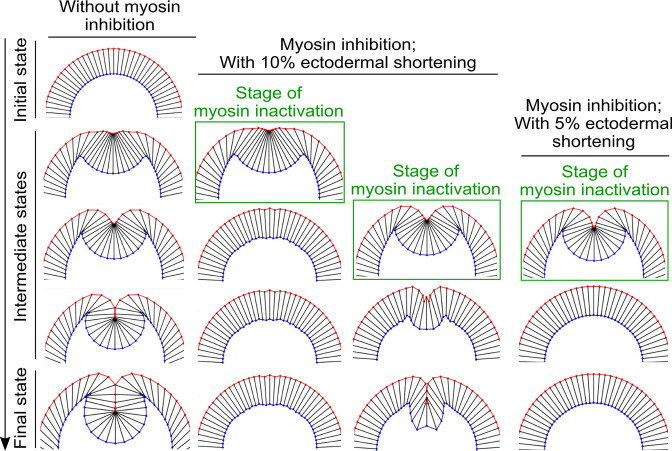
When the percent reduction of the ectodermal cell length is lowered from 20% to 10%, the binary response to acute myosin inhibition is still present, although the final depth of the furrow in the simulated Late Group embryo is reduced. Further lowering the percent reduction of the ectodermal cell length to 5% abolishes the binary response—in this case, the intermediate furrow always relaxes back to the surface of the embryo after myosin inhibition regardless of the stage of stimulation.
Figure 8—figure supplement 3. Measurement of ectoderm cross-section area in Late Group embryos.

Figure 8—figure supplement 3.

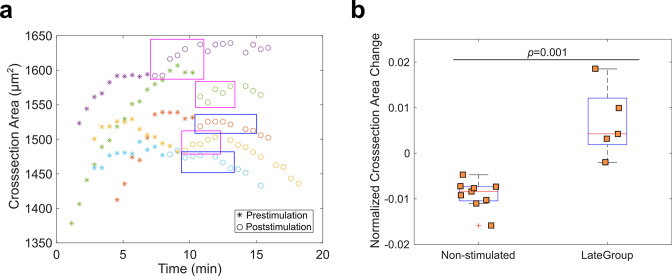
(a) To examine whether Rho1 inhibition influences ectodermal shortening, we measured the ectoderm cross-section area as a proxy of the ectodermal cell length (ectoderm thickness) for Late Group embryos. T0 is the onset of apical constriction. Each color is one Late Group embryo. In three out of five Late Group embryos, Opto-Rho1DN stimulation resulted in a slight increase in ectoderm thickness (magenta boxes). This increase is both mild and transient, and the trend of change in thickness rapidly resumed the pre-stimulation pattern (in 2–3 min). In the remaining two out of five Late Group embryos, Opto-Rho1DN stimulation did not have an obvious impact on ectoderm thickness (blue boxes). (b) Relative change of ectoderm cross-section area in non-stimulated control embryos and Late Group embryos. Shown is percent ectoderm area change within a 1.7-min duration, either immediately after stimulation (Late Group embryos) or after the maximal ectoderm area was reached (non-stimulated control embryos). Each data point represents one embryo. Wilcoxon rank-sum test is used for statistical comparison. The observed impact of Opto-Rho1DN stimulation on ectoderm thickness change was both mild and transient even though Rho1 inhibition was persistent, suggesting that Rho1 inhibition did not directly impact ectodermal shortening. Instead, the observed effect is likely to be an indirect consequence of the mild tissue relaxation near the constriction domain upon Rho1 inhibition (cell 9 in Figure 5f – j; Figure 6—figure supplement 1; data not shown).