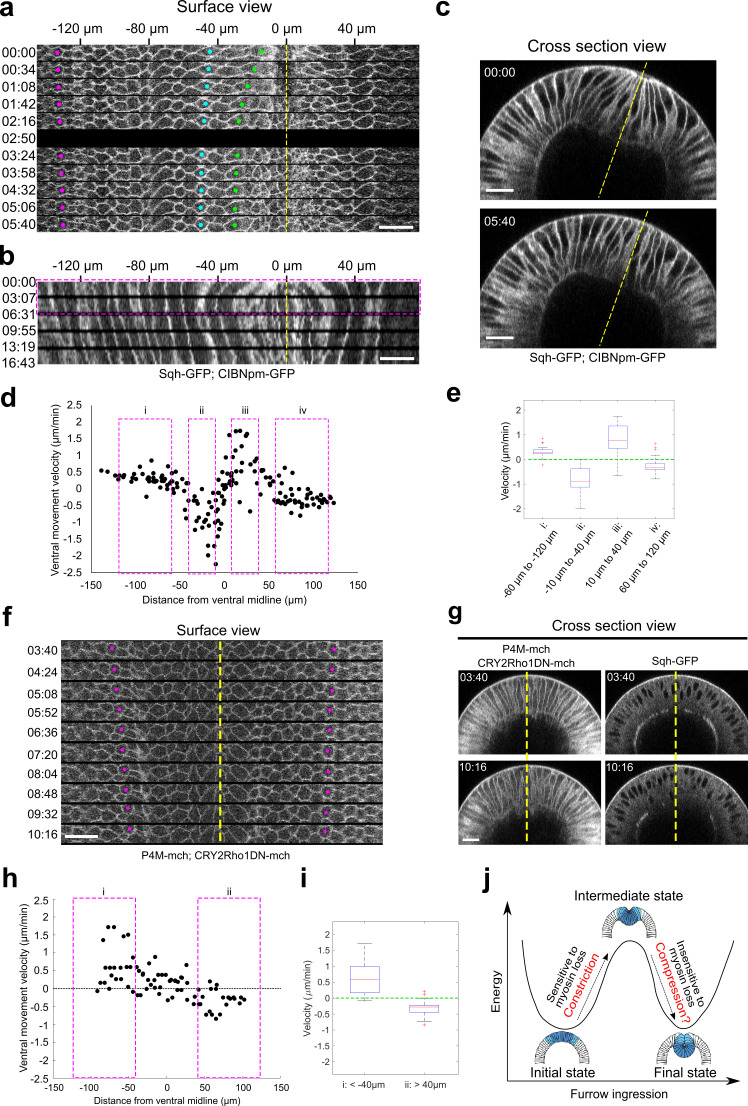
Figure 9. Lateral ectodermal cells still move ventrally in Early Group embryos when the ventral cells undergo apical relaxation upon Opto-Rho1DN stimulation.
(a) Montage showing the surface view of an Early Group embryo during the first 6 min after stimulation (T=0). Yellow dashed line depicts ventral midline. Despite the tissue relaxation in the ventral region of the embryo (green and cyan dots), the ectodermal cells continue to move toward the ventral midline. (b) Kymograph generated from the surface view of the same movie as shown in (a). Magenta box indicates the time window where the average velocity of tissue movement is measured. (c) Cross-section view of the same embryo in (a) showing the relaxation of the apical indentation at the ventral side of the embryo. Yellow line: DV axis. (d) Velocity of tissue movement as a function of the initial distance from the ventral midline. N=7 Early Group embryos. (e) Box plot showing the velocity of tissue movement at ventral mesodermal ((ii): from –10 μm to –40 μm, and (iii): from 10 μm to 40 μm) or lateral ectodermal ((i): from –60 μm to –120 μm, and (iv): from 60 μm to 120 μm) regions of the embryo. Statistical analysis testing whether the measured velocities are significantly larger (i, iii) or smaller (ii, iv) than 0 is performed using one-tailed one-sample t-test against 0. p<0.001 for all tests. (f, g) Surface kymograph (f) and cross-section views (g) of embryos expressing Opto-Rho1DN and stimulated at the onset of apical constriction. Yellow line: ventral midline. Ectoderm cells (magenta dots) still move toward ventral midline even though no ventral furrow was formed (g). The left and right panels in (g) show the mCherry and GFP signals from the same embryo. N=3 embryos. T=0 is the onset of apical constriction. All scale bars: 20 μm. (h) Velocity of tissue movement as a function of the initial distance from the ventral midline. N = 3 snail mutant embryos. (i) Box plot showing the velocity of tissue movement at lateral ectodermal regions of the embryo ((i): from –40 μm to –110 μm, and (ii): from 40 μm to 110 μm). Statistical analysis testing whether the measured velocities are significantly larger (i) or smaller (ii) than 0 is performed using one-tailed one-sample t-test against 0. p<0.001 for both tests. (j) Cartoon depicting the proposed model for mechanical bistability of the mesoderm epithelium during gastrulation. Actomyosin-mediated apical constriction is important for the system to transition from the initial state to an intermediate state, whereas the subsequent transition into the final, fully invaginated state is facilitated by ectodermal compression and is insensitive to loss of actomyosin contractility. The presence and potential function of ectodermal compression remain to be tested experimentally.

