. 2022 Feb 22;11:e69476. doi: 10.7554/eLife.69476

Figure 2. Ten-eleven translocation (TET) enzymatic activity impacts R-loop levels.

Quantification of 5-hydroxymethylcytosine (5hmC) and 5-methylcytosine (5mC) (A) and R-loops (B) dot blots of Tet1, Tet2, Tet3 single KD, and of Tet1/2/3 triple KD mouse embryonic stem (mES) cells. Dot blots are shown in Figure 2—figure supplement 1B. Data were normalized against dsDNA levels. *p<0.05, **p<0.01, ***p<0.001, two-tailed Student’s t-test. ND, not detected. (C) R-loop levels assessed by DNA:RNA immunoprecipitation (DRIP) in Tet1/2/3 triple KD mES cells. Data were normalized against RNase H-treated samples. *p<0.05, **p<0.01, two-tailed Student’s t-test. (D) Transcription levels of the genes presented in (C) assessed by RT-qPCR. 5hmC/5mC (E) and R-loop (F) levels determined by (h)MeDIP or DRIP at four regions of the APOE gene upon tethering of dCas9-TET1 or dCas9-dTET1 to the last exon of APOE in U-2 OS cells. R-loop data were normalized against RNase H-treated samples. *p<0.05, **p<0.01, two-tailed Student’s t-test. (G) APOE transcription levels upon targeting dCas9-TET1 or dCas9-dTET1 to the last exon of the gene in U-2 OS cells. Data shown are the mean and SD from at least three independent experiments.

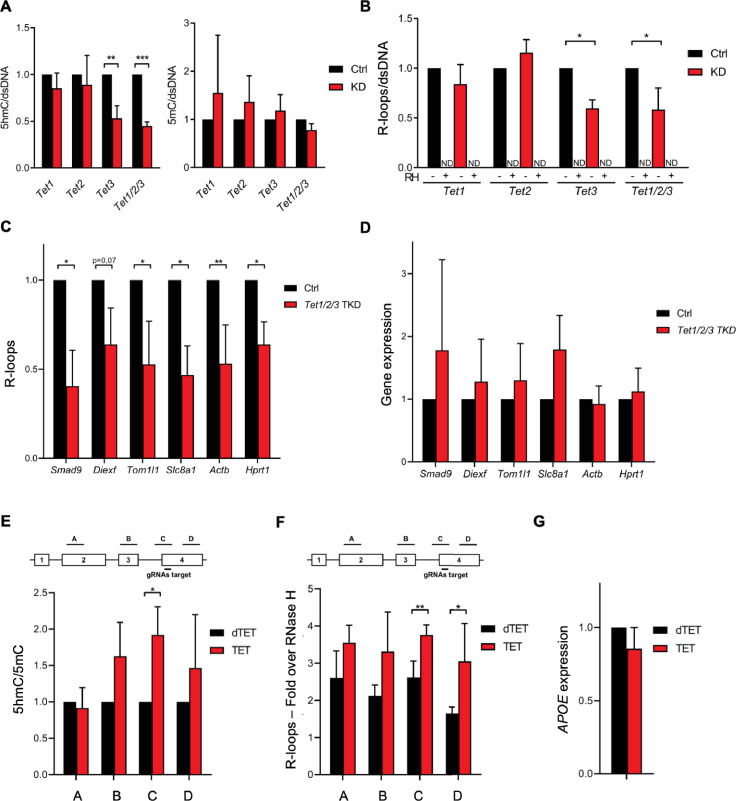
Figure 2.

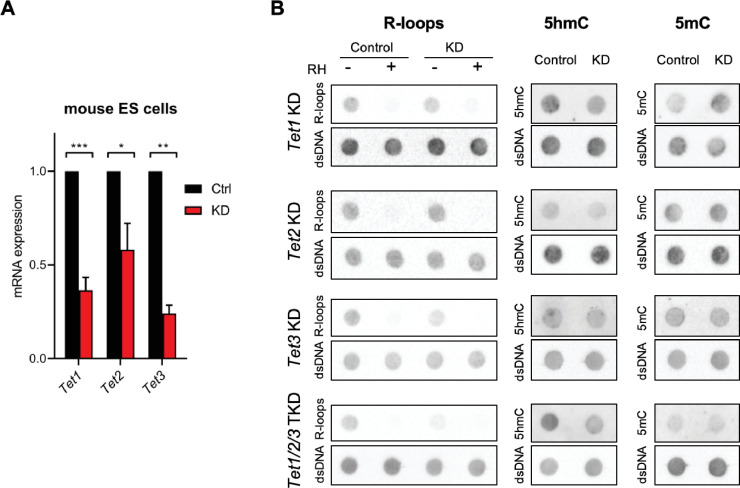
Figure 2—figure supplement 1. Impact of Tet depletion in mouse embryonic stem (mES) cells in R-loops, 5-hydroxymethylcytosine (5hmC), and 5-methylcytosine (5mC).

Figure 2—figure supplement 1.

(A) Tet1, Tet2, and Tet3 mRNA expression levels in mES cells 48 hr after RNAi depletion of Tet1, Tet2, or Tet3. *p<0.05, **p<0.01, ***p<0.001, two-tailed Student’s t-test. Graph shows the mean and SD from three independent experiments. (B) Dot blot of R-loops, 5hmC, and 5mC in Tet1, Tet2, and Tet3 single KD and in Tet1/2/3 triple KD mES cell extracts. dsDNA was detected after stripping and reprobing of the same membranes. Data are representative of a minimum of three independent experiments.
Figure 2—figure supplement 2. Tet depletion impacts R-loop formation in mouse fibroblasts.

Figure 2—figure supplement 2.

(A) Tet1, Tet2, and Tet3 mRNA expression levels in mouse fibroblasts 48 hr after RNAi depletion of Tet1, Tet2, or Tet3. **p<0.01, two-tailed Student’s t-test. (B) Dot blot of R-loops, 5-hydroxymethylcytosine (5hmC), and 5-methylcytosine (5mC) in Tet1, Tet2, and Tet3 single KD and in Tet1/2/3 triple KD mouse fibroblast extracts. dsDNA was detected after stripping and reprobing of the same membranes. Data are from three independent experiments. Quantification of the 5hmC, 5mC (C), and R-loops (D) dot blots shown in (B). *p<0.05, two-tailed Student’s t-test. ND, not detected. (E) DNA:RNA immunoprecipitations (DRIPs) performed in Tet1/2/3 triple KD mouse fibroblasts to assess the R-loop levels formed in the indicated genes. R-loop levels were normalized to the corresponding RNase H-treated sample. *p<0.05, **p<0.01, ***p<0.001, two-tailed Student’s t-test. (F) Transcription levels of the genes presented in (E) in control and Tet1/2/3 triple KD mouse fibroblasts. All graphs show the mean and SD from a minimum of three independent experiments.