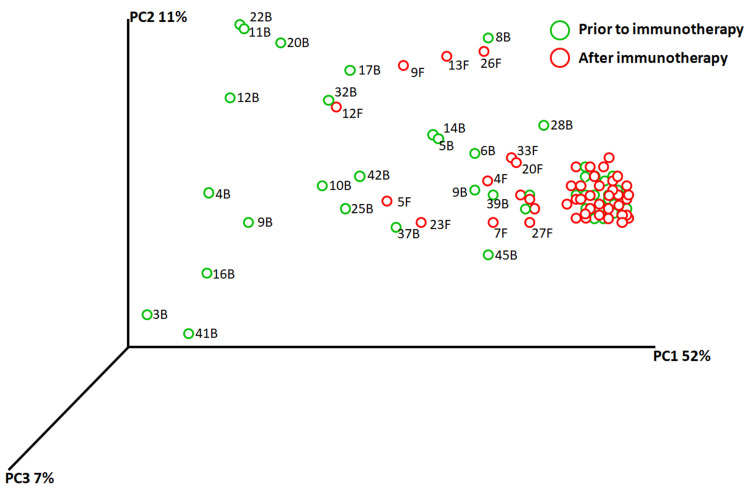
Figure 4.
PCA plots were used to show similarities of all microbiota samples based on patient using weighted UniFrac analysis based on species presence and absence also takes relative abundances of microbiota members into account. Using UniFrac distance matrices, samples are plotted in three-dimensional space so that the principal coordinates PC1 through PC3 show as much of the total variation among the samples as possible (in percent). Samples ID are unique color-coded.

