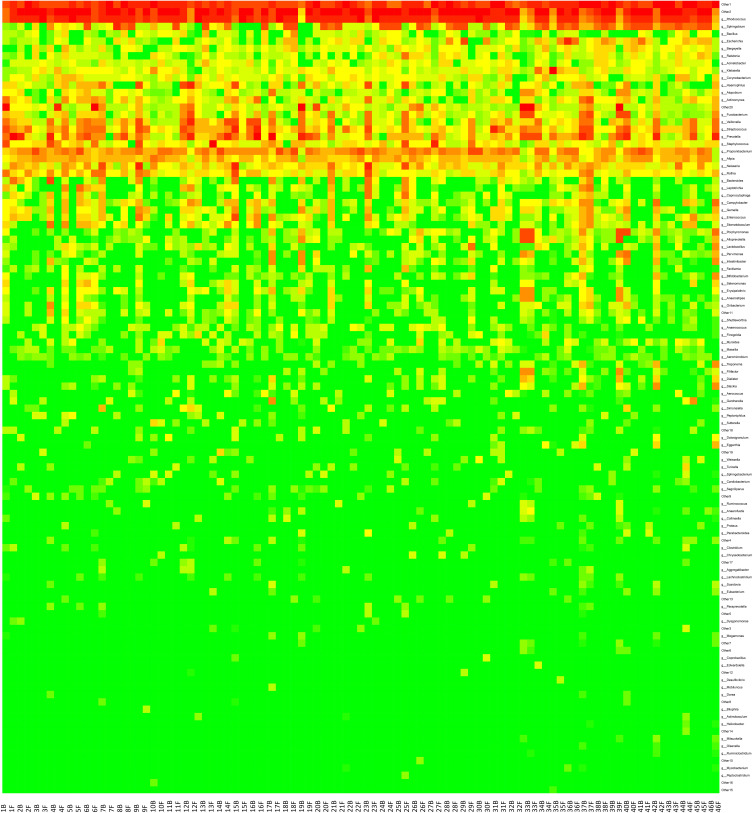
Figure 5.
Hierarchical clustering of immunotherapy response based on genus level microbiota compositions. Dendrograms show sample similarities based on similar patterns in relative abundance of microbiota members based on Euclidean distance calculations. Rows are also clustered hierarchically based on similar relative abundances across samples. The color of each entry is determined by the value of that fold difference, ranging from green (lower abundance) to red (higher abundance).

