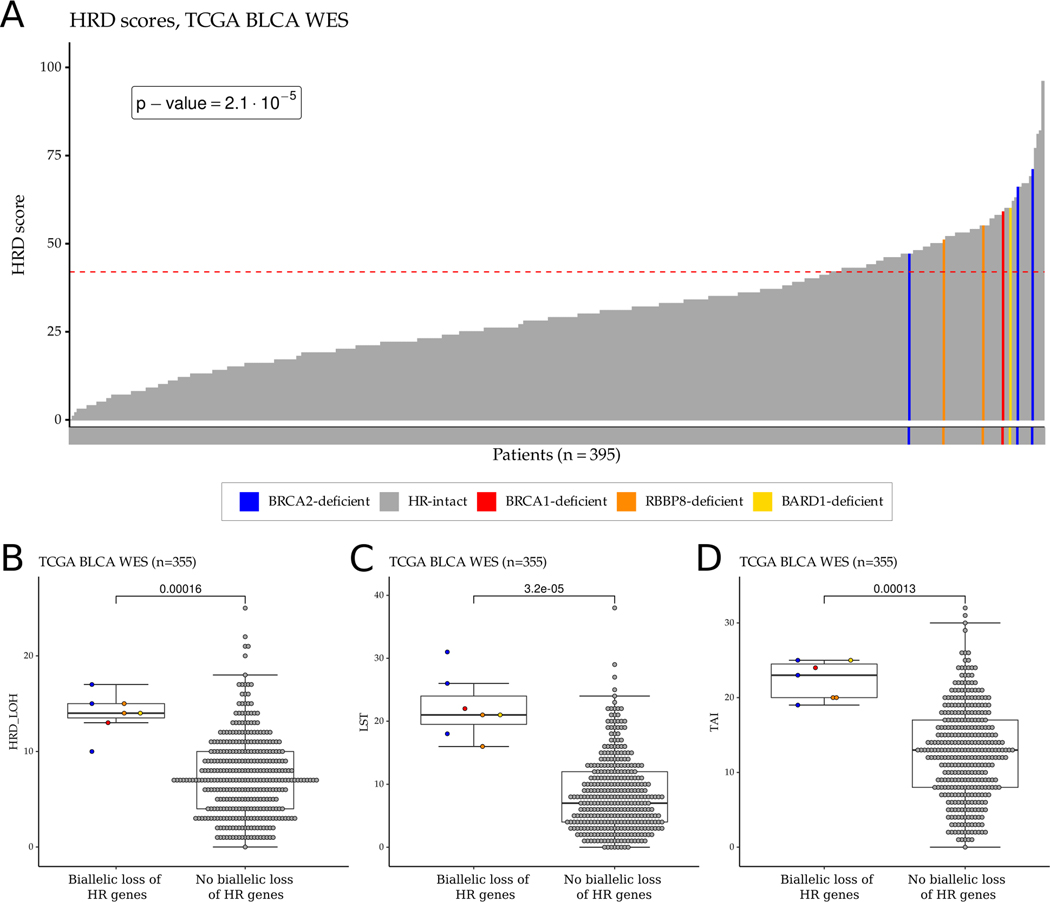
Figure 2:
HRD score distribution and HRD score components in the TCGA bladder cancer WES cohort. A. HRD score distribution of the samples in the TCGA bladder cancer WES cohort. The dashed red line represents the cut-off value (≥42) for HR deficiency previously defined for ovarian cancer. B-D. Boxplots showing the distribution of the number of HR deficiency-associated loss of heterozygosity (HRD-LOH) (B), large-scale state transition (LST) (C), and telomeric allelic imbalance (TAI) (D) events in the TCGA bladder cancer WES cohort. For each boxplot, the dark horizontal line within each box represents the median, the edges of the box represent the lower and upper bounds of the interquartile range (IQR), the upper whisker is the min(max(x), Q3+1.5×IQR) and the lower whisker is the max(min(x), Q1–1.5×IQR). ERCC2 mutant samples or samples with high ERCC2mut score were excluded from the boxplots. P-values were calculated by the Wilcoxon rank-sum test and no mathematical correction was applied for multiple comparisons.

