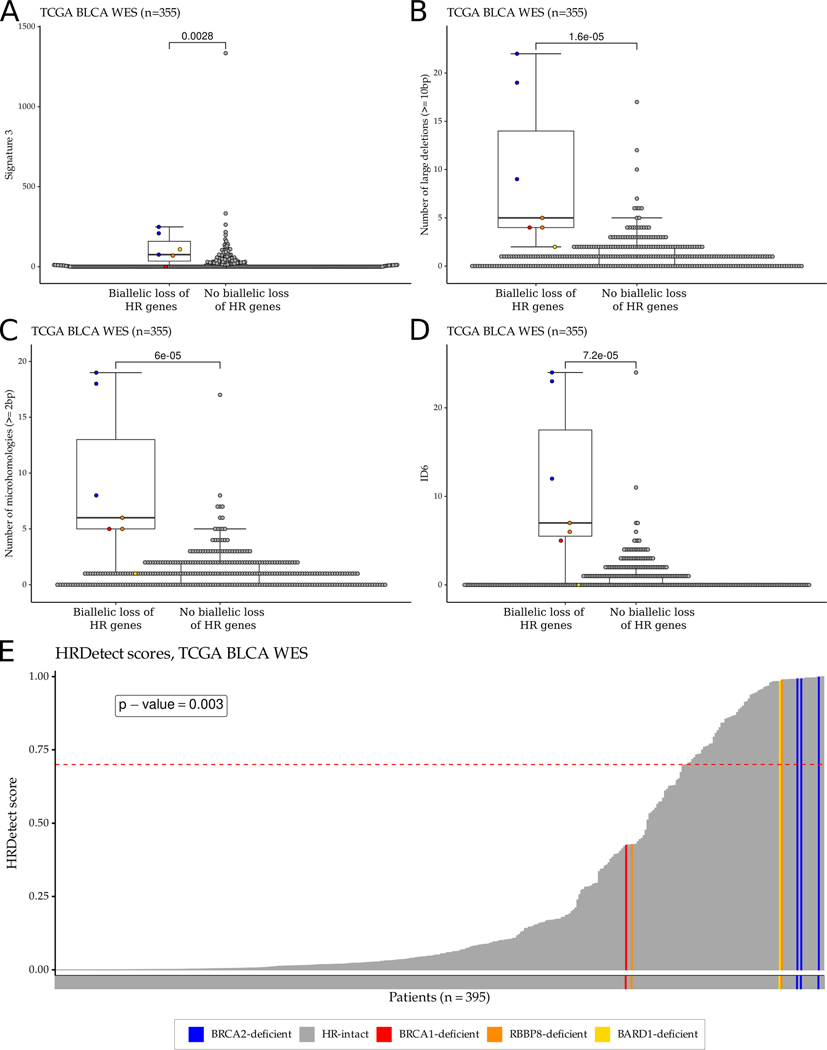
Figure 3:
HR deficiency-associated mutational signatures and HRDetect score distribution in the TCGA bladder cancer WES cohort. A-D. Boxplots showing the distributions of HR deficiency-associated mutational signatures: signature 3 (COSMIC v2) (A), the number of large (≥10bp) deletions (B), the number of microhomology-mediated deletions (C), and ID6 (COSMIC v3) (D). For each boxplot, the dark horizontal line within each box represents the median, the edges of the box represent the lower and upper bounds of the IQR, the upper whisker is equal to min(max(x), Q3+1.5×IQR) and the lower whisker is equal to max(min(x), Q1–1.5×IQR). ERCC2 mutant samples or samples with high ERCC2mut score were excluded from the boxplots. P-values were calculated by the Wilcoxon rank-sum test and no mathematical correction was applied for multiple comparisons. E. HRDetect score distribution of the samples in the TCGA bladder cancer WES cohort. The dashed red line represents the threshold (≥0.7) for HR deficiency previously defined for breast cancer.

