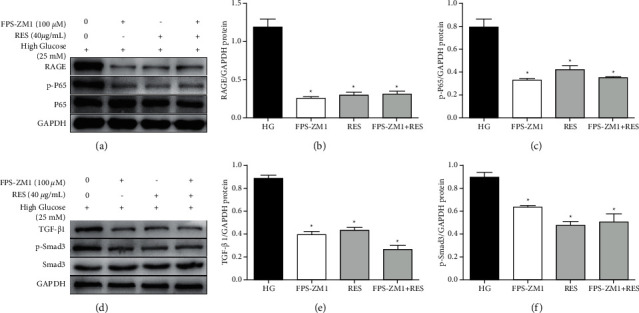
Figure 6.

RES suppressed the HG‐induced activation of pathways of TGF‐β1/Smad3 and NF-κB dependent on RAGE in vitro. H9c2 cells were treated with control medium or indicated concentration of RES (40 μg/mL) or FPS-ZM1 (100 μM) for 24 h. WB analysis of RAGE, p-NF-κB P65, P65, TGF‐β1, p-Smad3, Smad3, and GAPDH levels was performed. (a, d) Representative WB images of RAGE, p-NF-κB P65, P65, TGF‐β1, p-Smad3, Smad3, and GAPDH levels; (b) protein expression of RAGE, (c) p-NF-κB P65, (e) TGF‐β1, and (f) p-Smad3. The levels of protein were determined by densitometry and normalised to the levels of GAPDH. The data are presented as the means ± SD of the three repeated experiments; ∗p < 0.05 vs, HG group.
