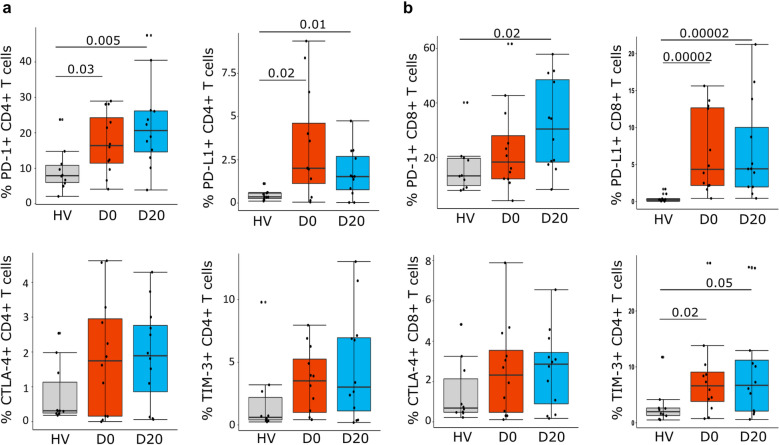
Fig. 2.
Immune-inhibitory receptors expressions on CD4 + and CD8 + T cells in severe COVID-19 patients. PD-1, PD-L1, CTLA-4 and TIM-3 expressions were assessed by flow cytometry in PBMCs from COVID-19 patients (n = 12) at day 0 (D0) and day 20 (D20) and healthy volunteers (HV, n = 10). Results are presented as individual values and boxplots. a Expressions on CD4 + T cells are presented. b Expressions on CD8 + T cells are presented. Nonparametric Mann–Whitney U test was used to compare results between HV and COVID-19 patients. Only statistically significant differences are shown

