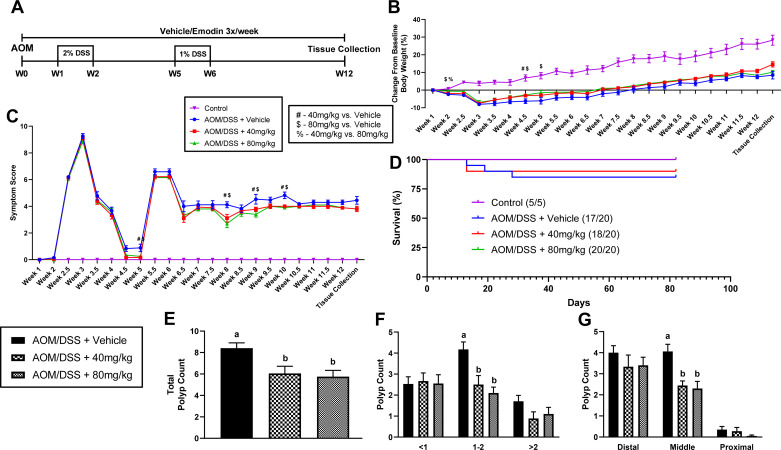
Figure 2.
Emodin reduces polyp count in AOM/DSS mice. A: experimental design. B: percent (%) change in body weight from start of experiment (W1). C: symptom score. #Statistical significance (P < 0.05) between 40 mg/kg and vehicle-treated mice, $statistical significance (P < 0.05) between 80 mg/kg and vehicle-treated mice, %statistical significance (P < 0.05) between 40 and 80 mg/kg-treated mice from one-way ANOVA, n = 5–20/group. D: survival curve. E: total polyp count. F: polyp size. G: polyp location. Groups not containing the same letter (a and b) indicates statistical significance between groups (P < 0.05) from one-way ANOVA, n = 5–20/group. AOM/DSS, azoxymethane/dextran sodium sulfate.

