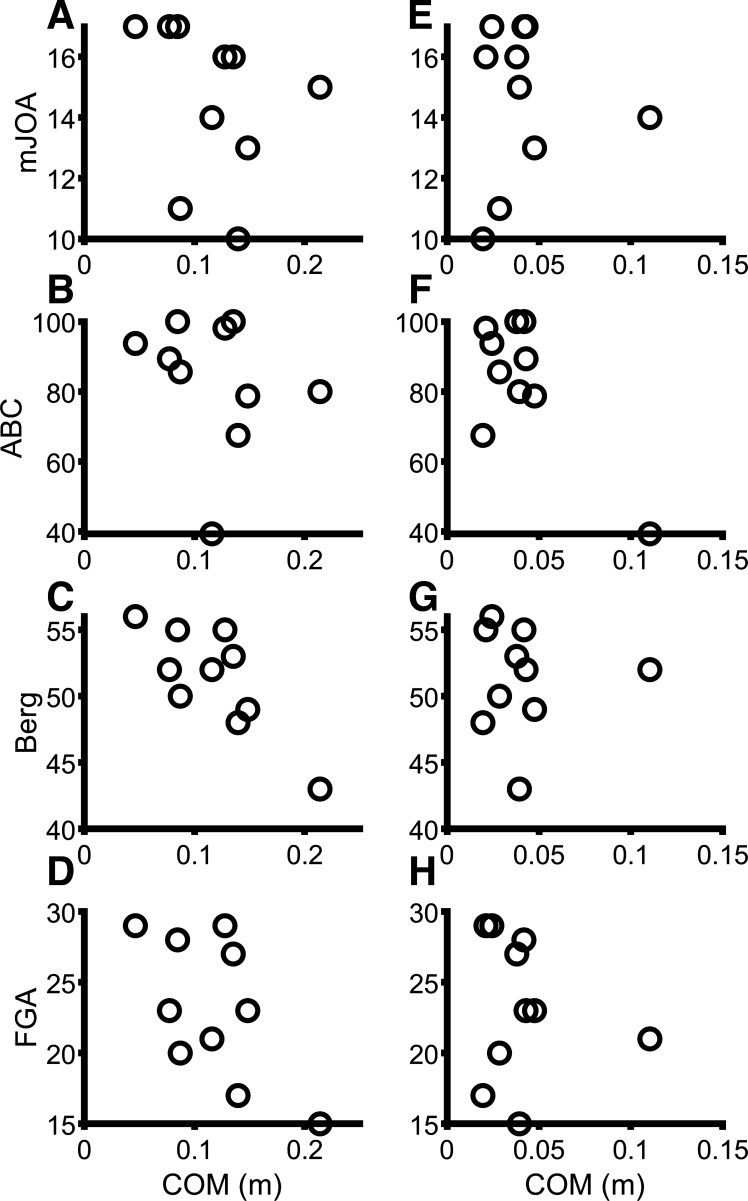
Figure 10.
Scatterplots for correlations between center of mass (COM) excursion and modified Japanese Orthopedic Association (mJOA; A and E), activity specific balance confidence (ABC; B and F), Berg (C and G), and functional gait assessment (FGA; D and H) scales. A–D: narrow stance, Unpredictable 12%. E–H: shoulder-width stance, Unpredictable 12%.

