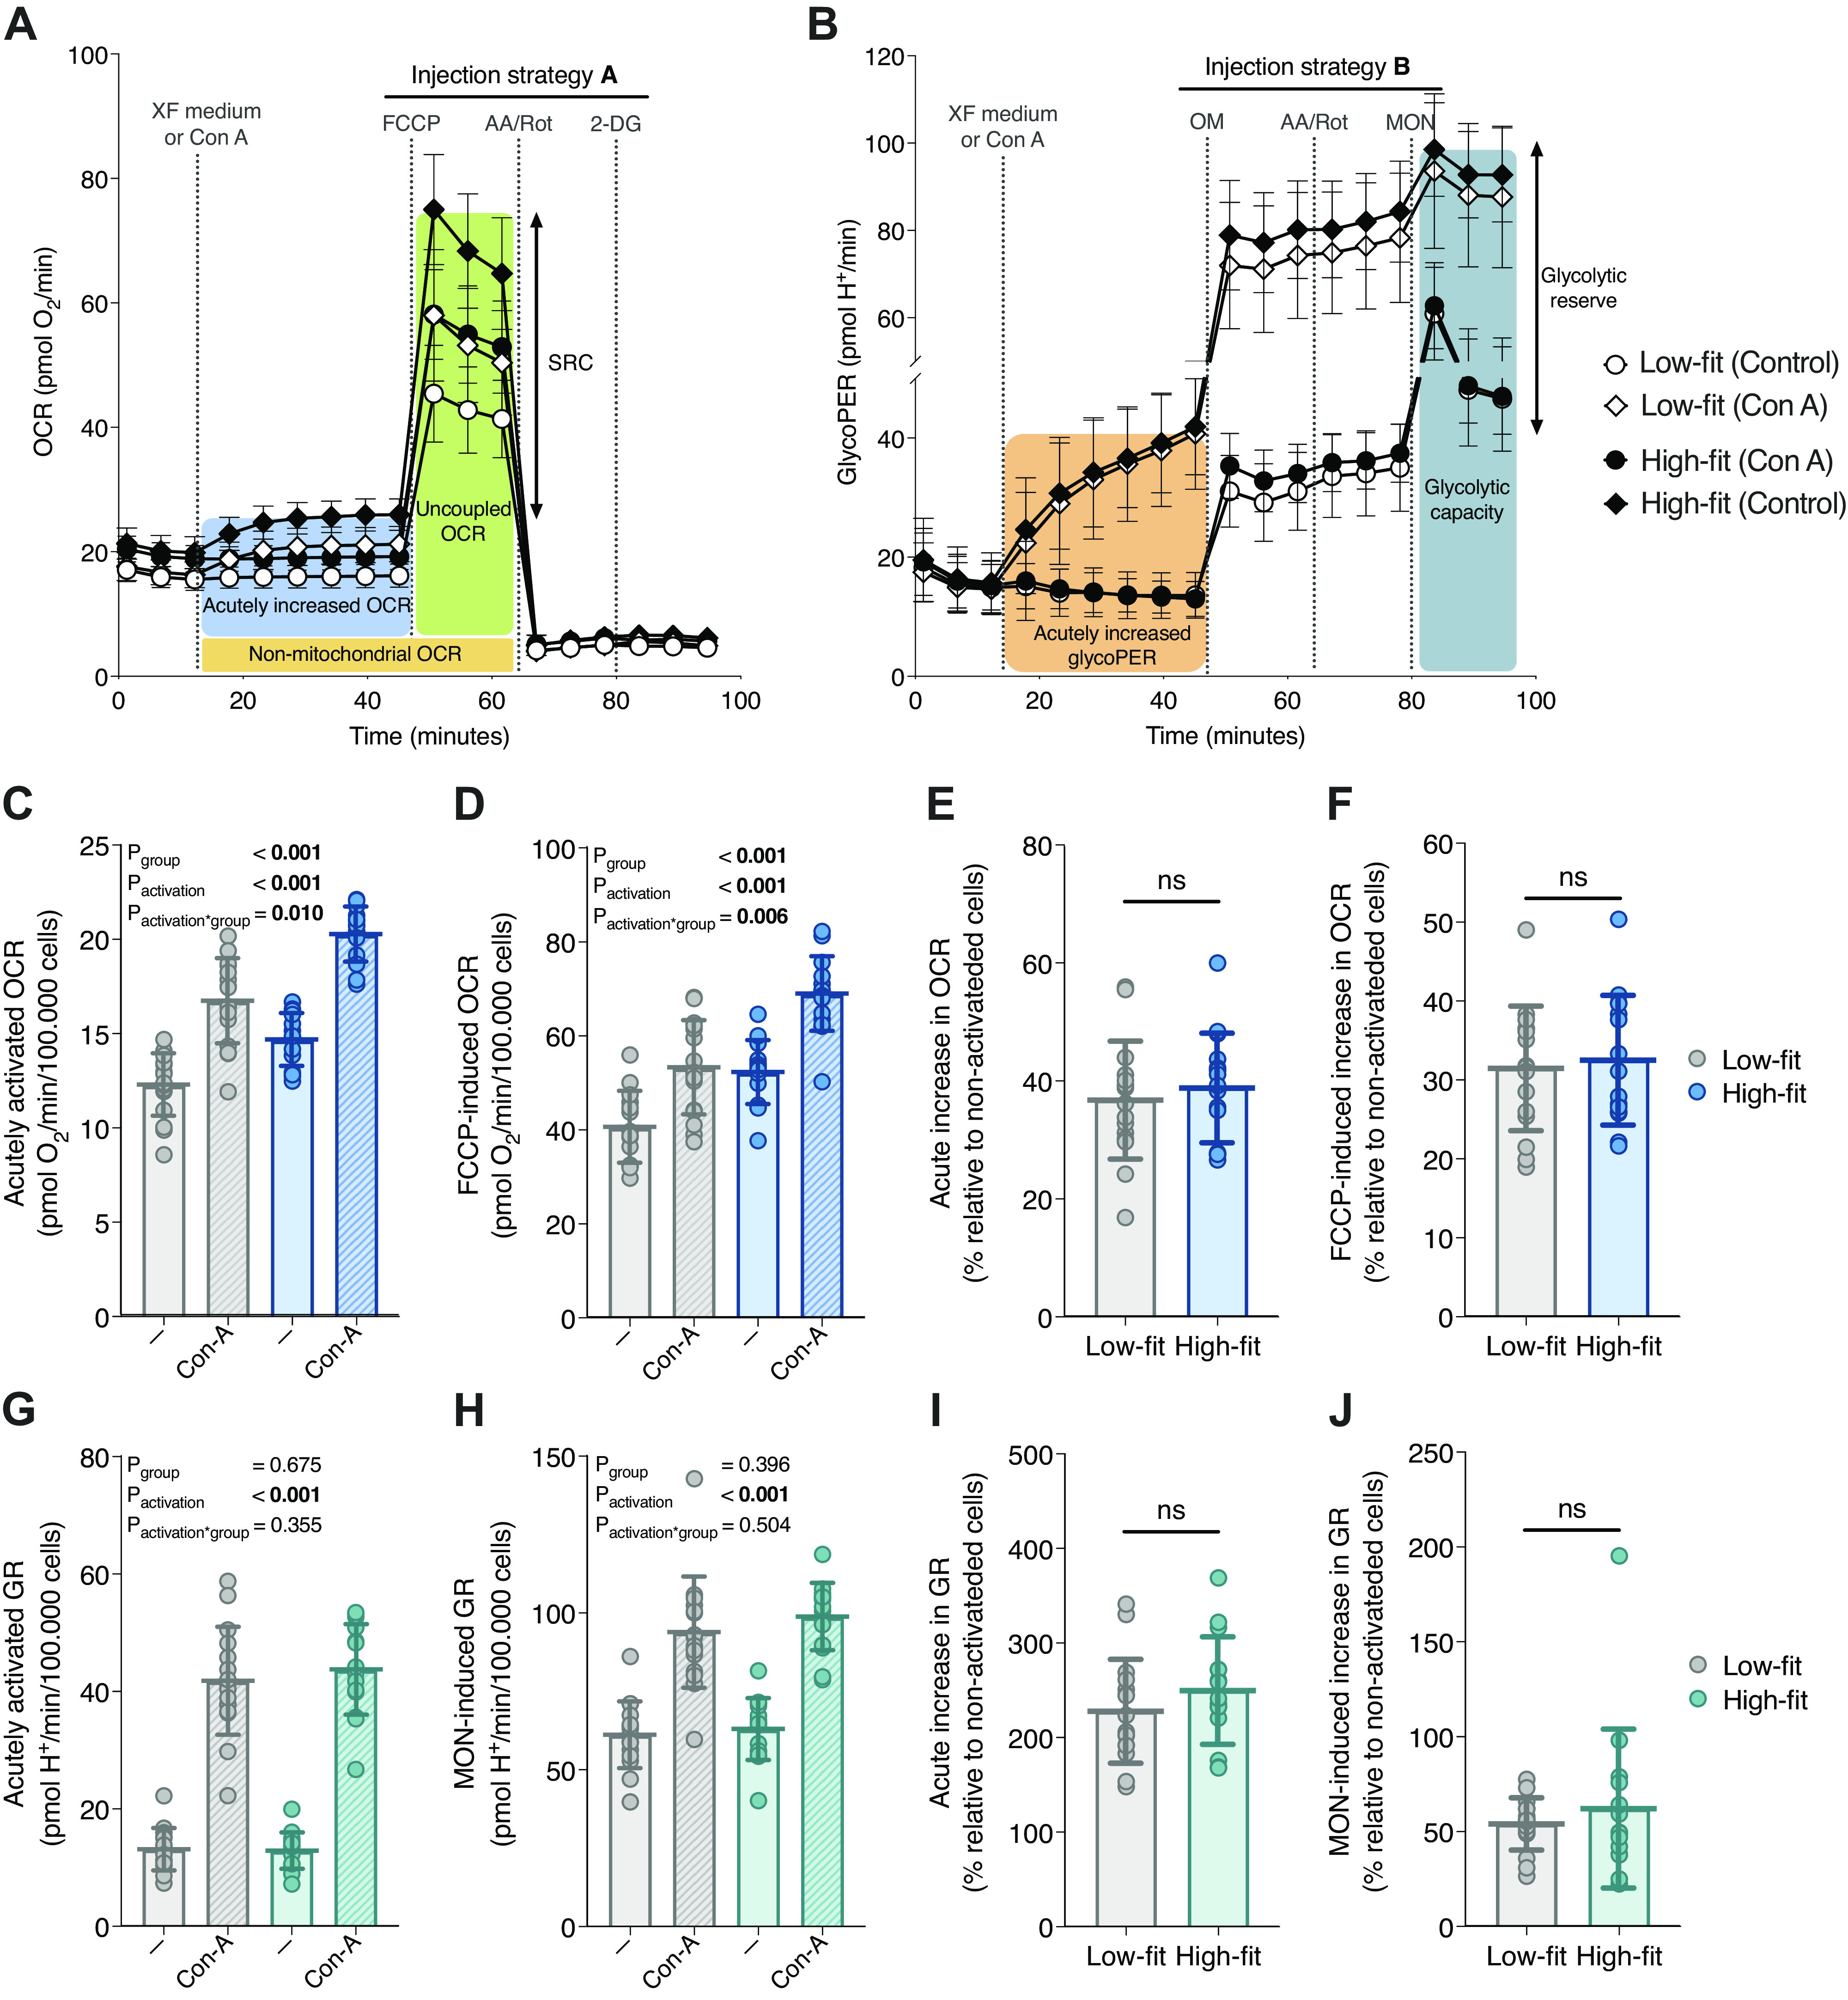
Figure 4.

The effect of acute peripheral blood mononuclear cell (PBMC) stimulation on mitochondrial and glycolytic PBMC function in high-fit and low-fit females. Representation of the mitochondrial (A) and glycolytic (B) parameters derived from the induced extracellular flux (XF) assay using a first injection with XF assay medium for quiescent, control PBMCs (dots), or the mitogen Concanavalin A (Con A) for activated PBMCs (diamonds) followed by injection strategy A (A) or B (B) for low-fit (n = 16, white) and high-fit (n = 15, black) females. Acutely activated (C) and FCCP-induced (D) oxygen consumption rate (OCR) per 105 R-integrated pixel intensity (PIXI) analyzed cells in control PBMCs (clear bars) or Con A-stimulated PBMCs (striped bars) from low-fit (n = 16, gray) and high-fit (n = 15, blue) females. The acute increase in OCR (E) and FCCP-induced OCR (F) in Con A-stimulated PBMCs compared with control PBMCs (%) in low-fit (n = 16, gray) and high-fit (n = 15, blue) females. Acutely activated (G) and monensin (MON)-induced (H) glycolytic rate (GR) per 105 PIXI analyzed cells in control PBMCs (clear bars) or Con A-stimulated PBMCs (striped bars) from low-fit (n = 16, gray) and high-fit (n = 15, turquoise) females. The acute increase in GR (I) and MON-induced GR (J) in Con A-stimulated PBMCs compared with control PBMCs (%) in low-fit (n = 16, gray) and high-fit (n = 15, turquoise) females. Main effects (fitness level and Con A) and interaction effects were analyzed using repeated-measures ANOVA (RM-ANOVA) (C, D, G, and H) and the relative Con A-induced differences were analyzed using unpaired Student’s t tests (E, F, I, and J). Significant P values (<0.05) are indicated in bold. ns, not significant.
