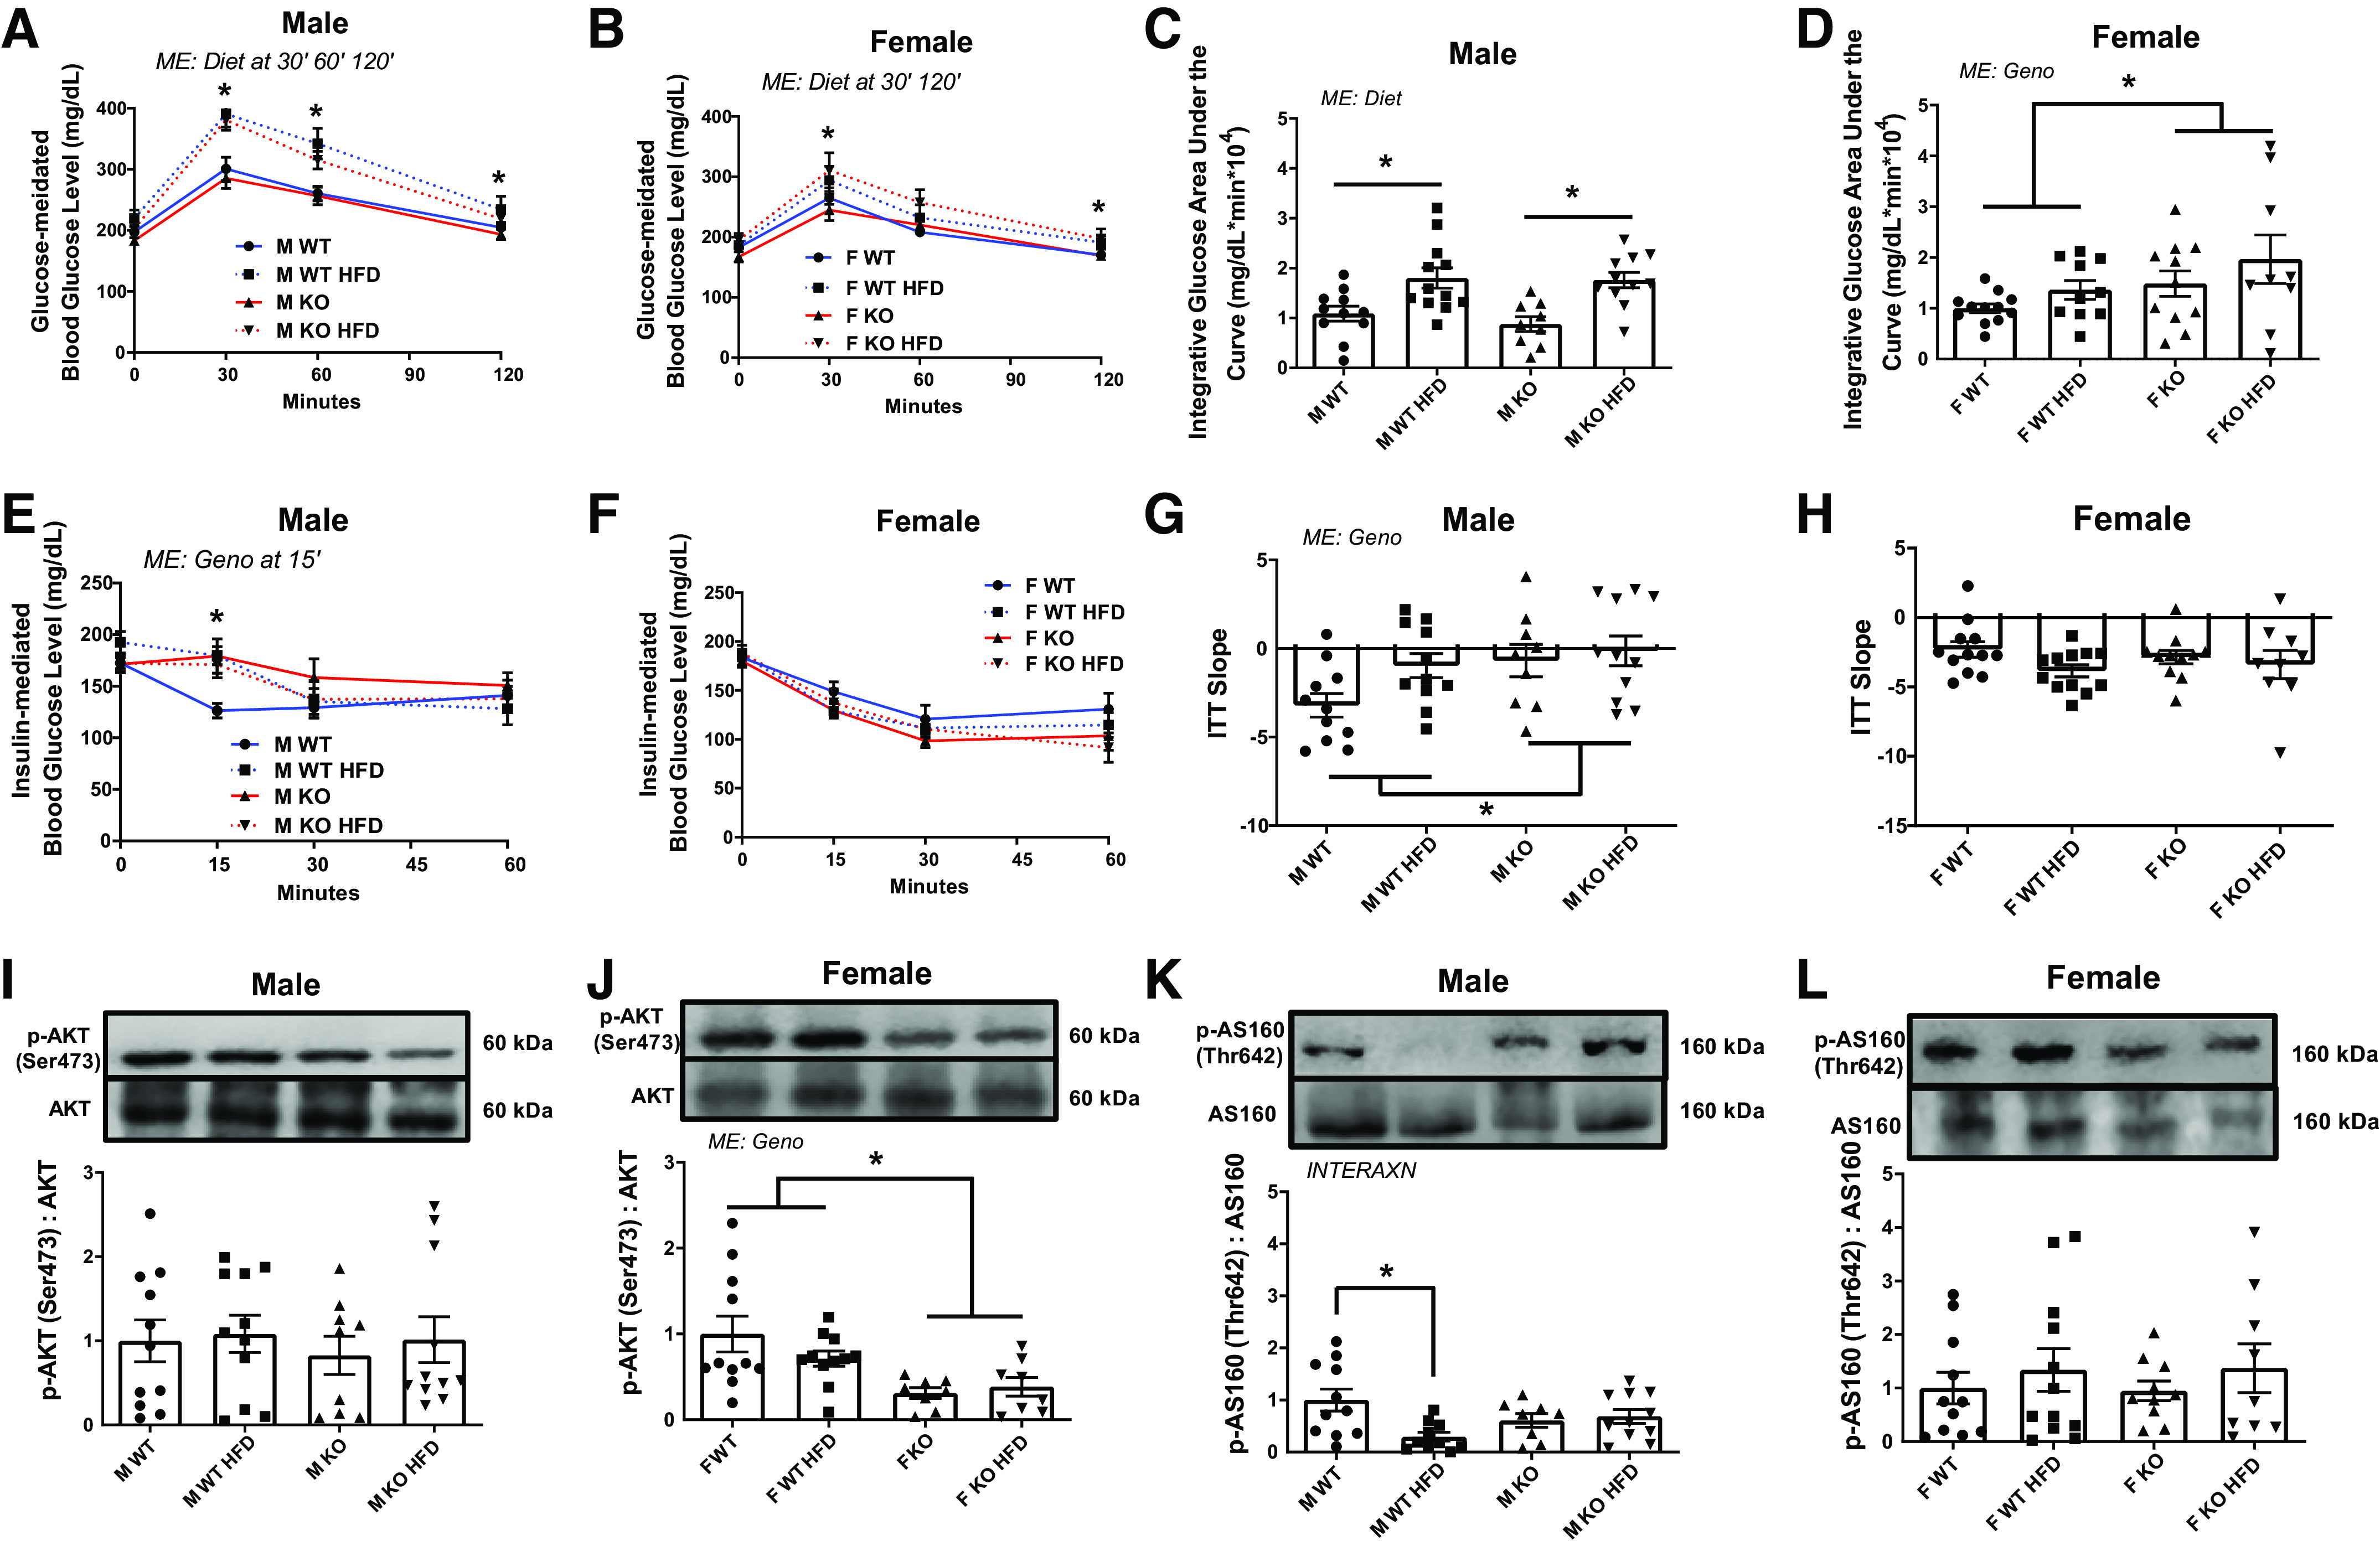
Figure 2.

In vivo glucose handling. A and B: blood glucose level before (0 min) and after glucose administration (30, 60, and 120 min). C and D: integrative area under the curve (IAUC) for A and B. E and F: blood glucose level before (0 min) and after insulin administration (15, 30, and 60 min). G and H: insulin tolerance test (ITT) slope for first 15 min of insulin-mediated blood glucose level. I and J: insulin-mediated phosphorylation of Akt (p-Akt) (Ser473) level via immunoblotting. K and L: p-AS160 (Thr642) level via immunoblotting. Data analyzed by two-way ANOVA with Tukey’s post hoc test where appropriate. Data described as means ± SE. Statistical differences are denoted as *P < 0.05 (An n of 9–12 animals per group was used). INTERAXN, interaction effect; KO, knockout; ME, main effect of indicated factor; WT, wild type.
