
Figure 4.
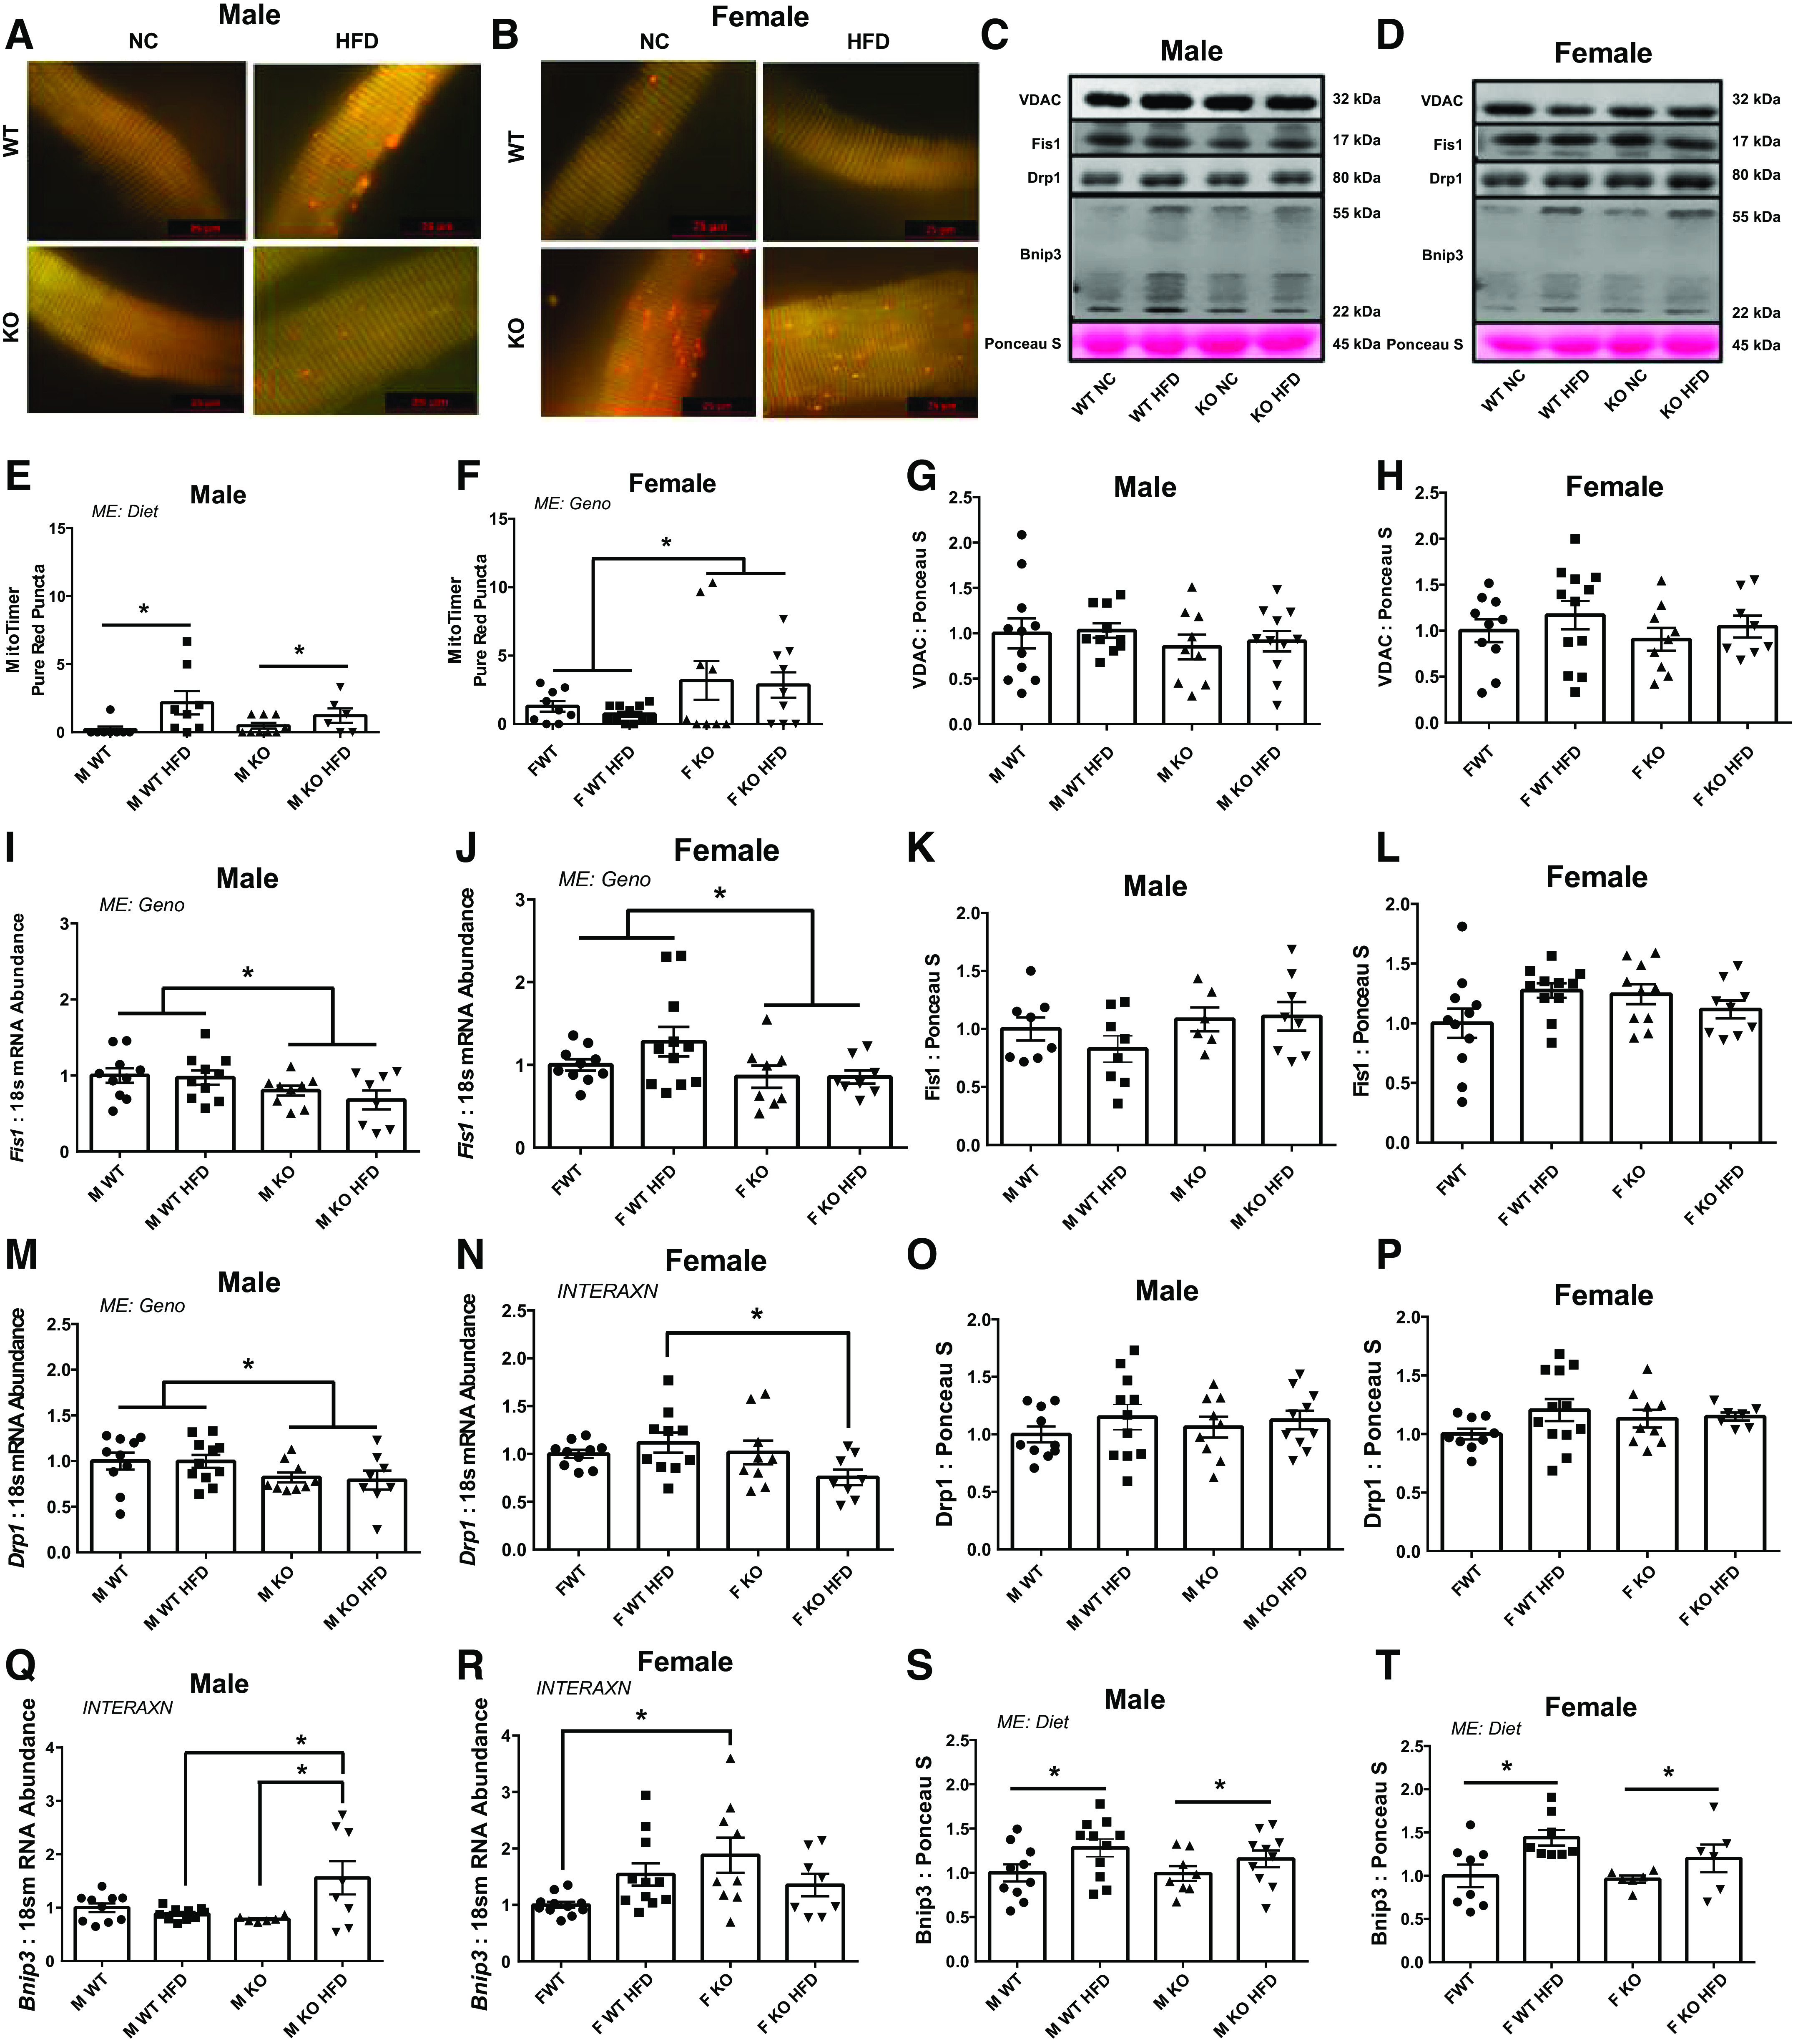
Mitochondrial network health. A and B: representative images of pMitoTimer in single muscle fiber. C and D: representative Western blot images for voltage-dependent anion channel (VDAC), fission protein 1 (Fis1), dynamin-related protein 1 (Drp1), and Bcl2 interacting protein 3 (Bnip3). E and F: pMitoTimer pure red puncta level. G and H: protein content of VDAC via immunoblotting. mRNA (I and J) and Protein content (K and L) for Fis1. mRNA (M and N) and protein content (O and P) for Drp1. mRNA (Q and R) and protein content (S and T) for Bnip3. Data analyzed by two-way ANOVA with Tukey’s post hoc test where appropriate. Data described as means ± SE. Statistical significance identified by denoting as * for main effect of genotype or diet, and as “different letters” for an interaction effect with α value set at P < 0.05 (An n of 7–11 animals per group was used). HFD, high-fat diet; INTERAXN, interaction effect; KO, knockout; ME, main effect of indicated factor; WT, wild type.