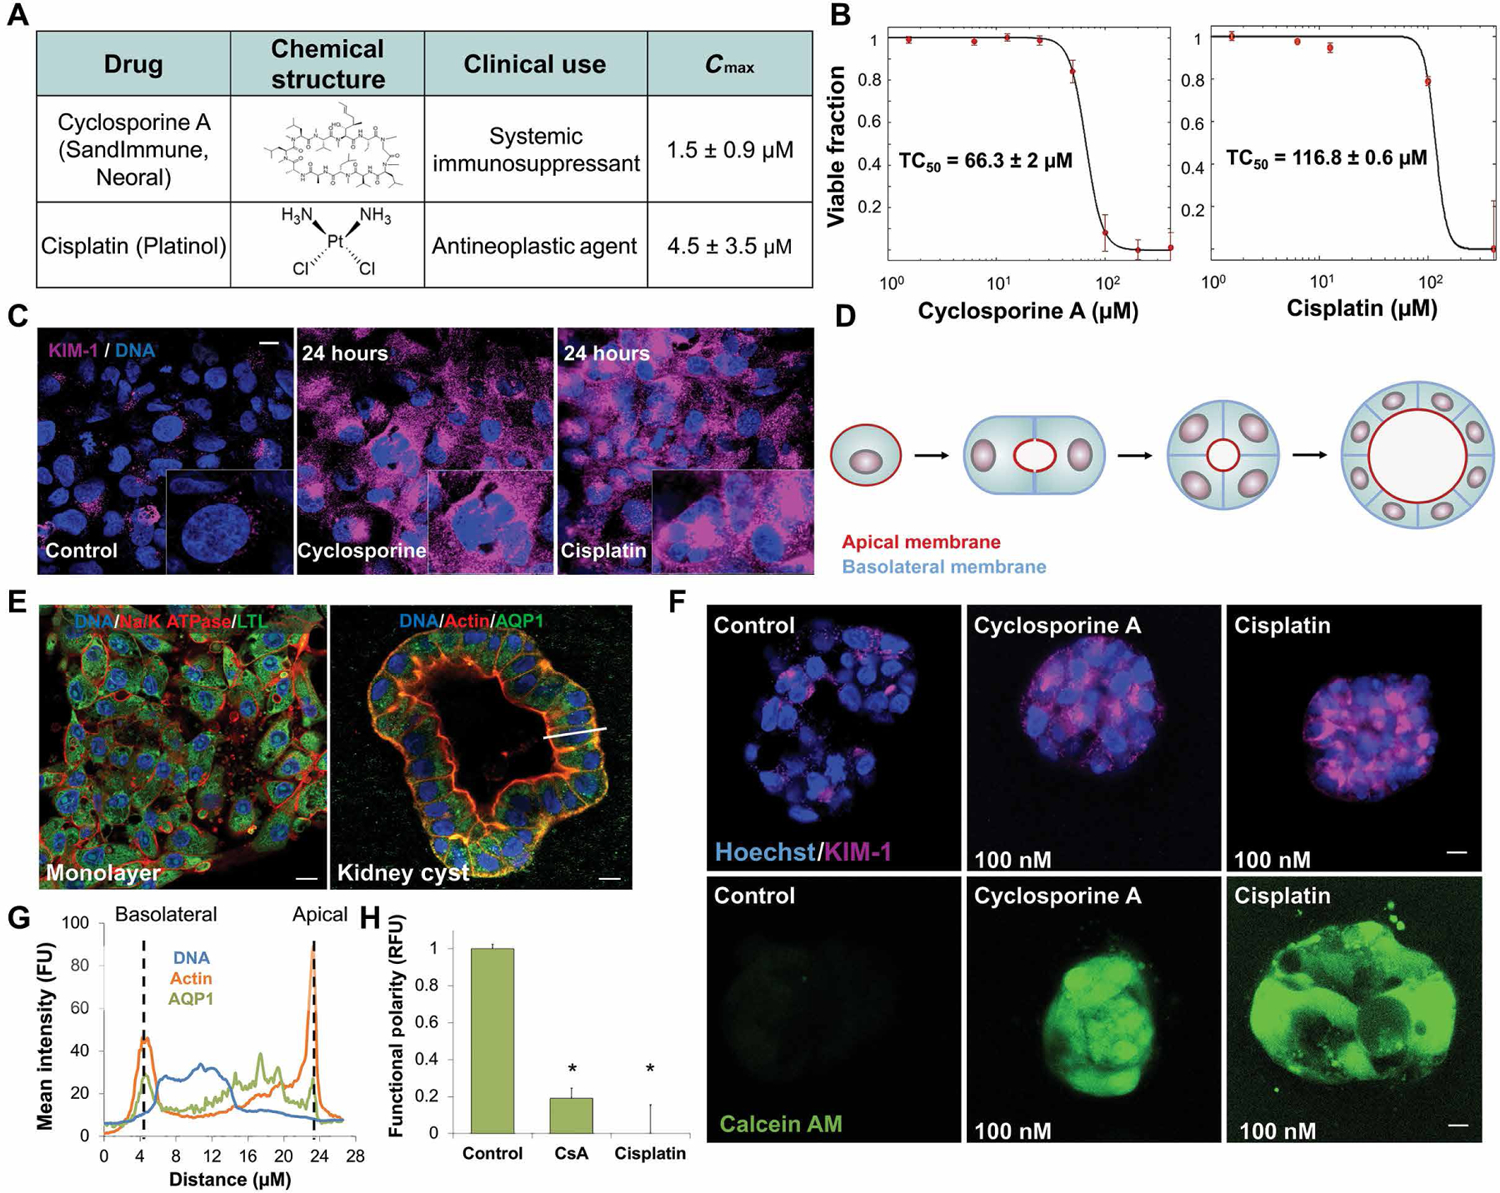
Fig. 1. Physiological doses of cyclosporine and cisplatin disrupt proximal tubule polarization.

(A) Table of structure, clinical use indications, and maximal physiological concentration (Cmax) of cyclosporine and cisplatin. (B) Dose-dependent toxicity curves of primary human proximal tubule cells (hPTCs) exposed for 24 hours to cyclosporine (TC50 = 66 μM) or cisplatin (TC50 = 95 μM) in 2D cell culture. (C) Immunofluorescence staining of acute kidney injury marker KIM-1 in hPTCs after 24-hour exposure to physiological doses of cyclosporine or cisplatin. (D) Schematic of 3D cyst formation, modeling proximal tubule polarity in vitro from single- and multicell suspensions in matrix. (E) Immunofluorescence staining of hPTCs in monolayer and 3D cyst formation. White bar indicates subsequent analyzed cross section in (G). (F) Functional polarity assay in cysts exposed to minute doses of cyclosporine or cisplatin for 24 hours. Fluorescent calcein is excreted through MDR1 (P-gp) in polarized cells. (G) Mean fluorescence intensity of cross section indicated by the white bar in (E), demonstrating polarized protein expression in hPTC cysts. FU, fluorescent unit; RFU, relative fluorescent unit. (H) Quantification of the loss of functional polarity. Scale bars, 10 μm. n = 4. N = 3. *P < 0.05, Student’s t test. Error bars indicate ± SE.
