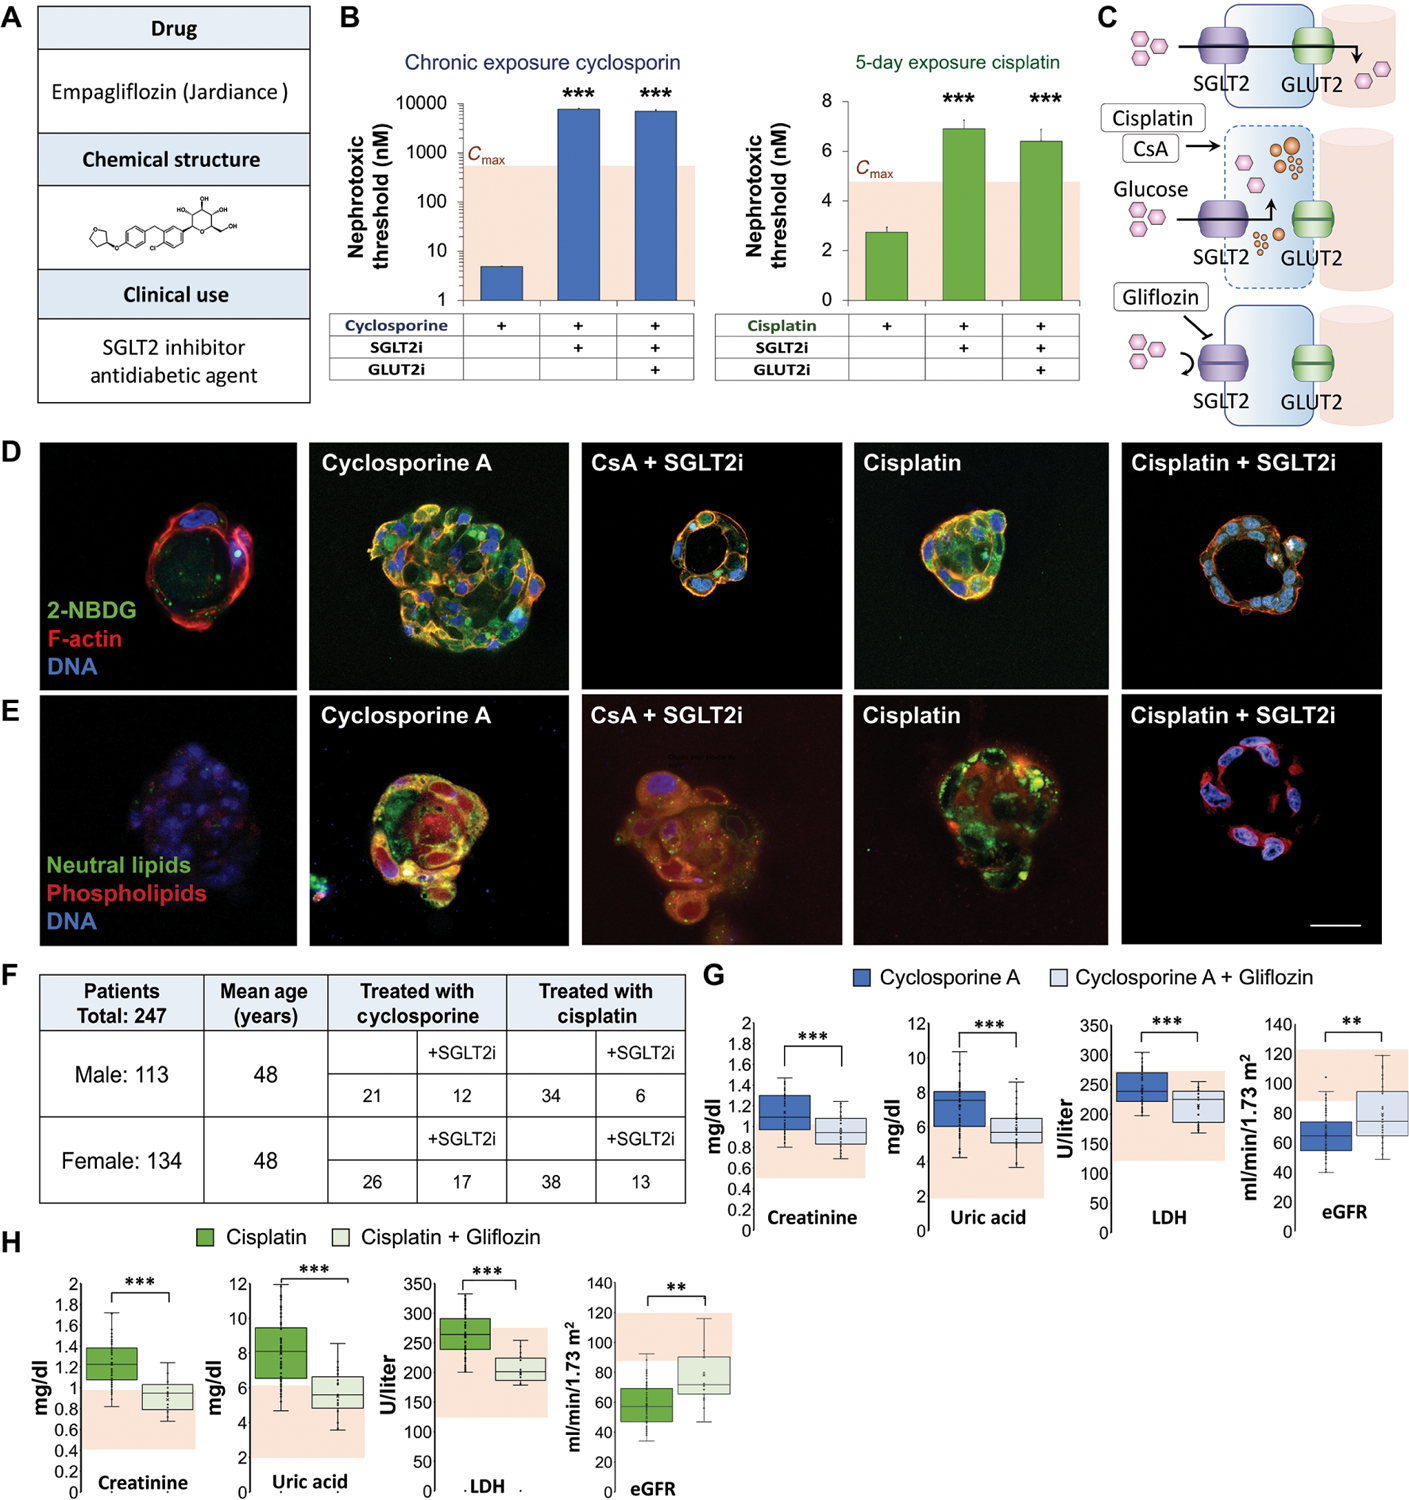
Fig. 4. Cyclosporine and cisplatin toxicity are reversed by SGLT2 inhibition.

(A) Structure and clinical indication of U.S. Food and Drug Administration–approved SGLT2 inhibitor (SGLT2i) empagliflozin. (B) Quantification of NTs in vascular kidney spheroids exposed to cyclosporin or cisplatin at various concentrations (400, 200, 100, 50, 25, 12, 6.2, 3.1, and 1.5 μM) in the presence of empagliflozin (SGLT2i) or empagliflozin and phloretin, glucose transporter-2 inhibitor (GLUT2i). Student’s t test. n = 9. N = 3. (C) Schematic of glucose transport in proximal tubule cells and mechanism of nephroprotective effect of empagliflozin (gliflozin). (D) Fluorescent glucose analog (2-NBDG) accumulation in 3D cysts exposed to low concentrations (100 nM) of cyclosporine or cisplatin for 30 min in the presence or absence of empagliflozin (SGLT2i). Control, cyclosporine A, and cisplatin images are reproduced from Fig. 3G for comparison. (E) Lipid accumulation in 3D cysts exposed to cyclosporine or cisplatin for 48 hours in the presence or absence of empagliflozin. Control, cyclosporine A, and cisplatin images are reproduced from Fig. 3H for comparison. (F) Table summarizing the number of patients with kidney damage in each group of a retrospective clinical study according to their treatment. (G) Box plots showing serum creatinine, uric acid, lactate dehydrogenase (LDH) concentrations, and estimated glomerular filtration rate (eGFR) in patients treated with cyclosporine compared to those treated with both cyclosporine and empagliflozin. Shaded area indicates normal values. (H) Box plots showing serum creatinine, uric acid, LDH concentrations, and eGFR in patients treated with cisplatin compared to those treated with both cisplatin and empagliflozin. Shaded area indicates normal values. Scale bars, 25 μm. Error bars indicate ±SE. Box plot center line indicates median; the cross indicates mean; box upper and lower limits indicate third and first quartiles, respectively; whiskers indicate 1.5× interquartile range; and points are data points. **P < 0.01, ***P < 0.001, Student’s t test.
