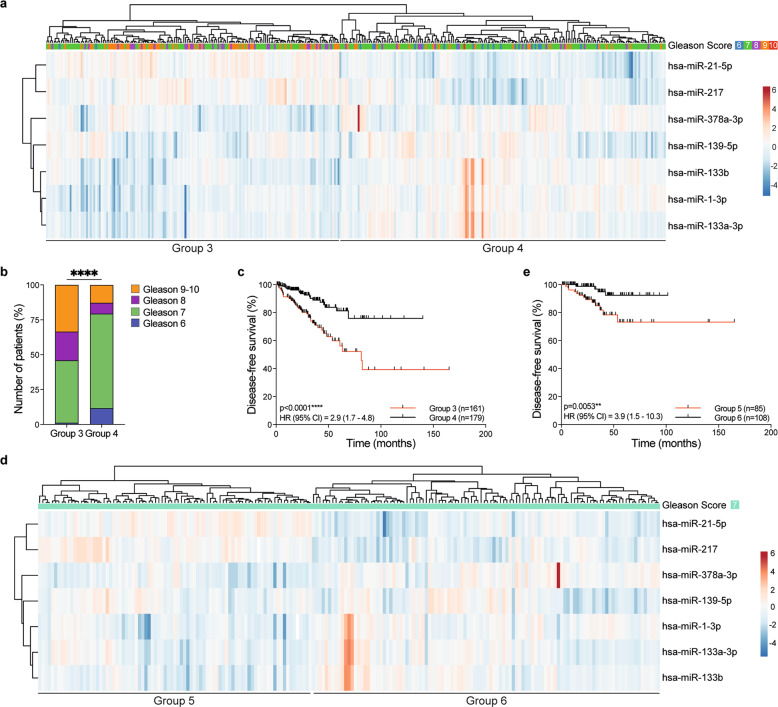
Fig. 1. A 7-miRs prognostic signature in primary human prostate cancer.
a Unsupervised hierarchical clustering of TCGA N0 PCa patients using expression (log2 RPM [reads per million]) of 7-miRs identified from miR RNAseq data. Columns: individual patients, rows: individual miRs. Centering and unit variance scaling are applied to rows, and rows and columns are clustered using correlation distance and average linkage. The dendrogram at the top shows Gleason scores (G6: blue; G7: green; G8: purple; G9: orange; G10: red). b Bar chart showing the Gleason score distribution among patients (y-axis) in Groups 3 and 4 (x-axis). G6: blue; G7: green; G8: purple; G9-10: orange. ****p ≤ 0.0001; Chi-square test. c Kaplan–Meier plot of disease-free survival in Groups 3 and 4 patients. The number of patients (n) in each group is indicated. ****p ≤ 0.0001; 95% CI = 2.9 (1.7–4.8); Mantel–Cox test. Median survival Group 3: 81.24 months; median survival Group 4: not reached. d Unsupervised hierarchical clustering analysis of TCGA N0 PCa patients presenting Gleason 7 score using expression (log2 RPM) of 7-miR identified from miR RNAseq data. Columns: individual patients, rows: individual miRs. Centering and unit variance scaling are applied to rows, and rows and columns are clustered using correlation distance and average linkage. The dendrogram shows Gleason score for each patient (G7: green). e Kaplan–Meier plot of disease-free survival in Group 5 and Group 6 patients. The number of patients (n) in each group is indicated. **p = 0.0053; HR 95% CI = 3.9 (1.5–10.3); Mantel–Cox test. Median survival Group 5: not reached; median survival Group 6: not reached.

