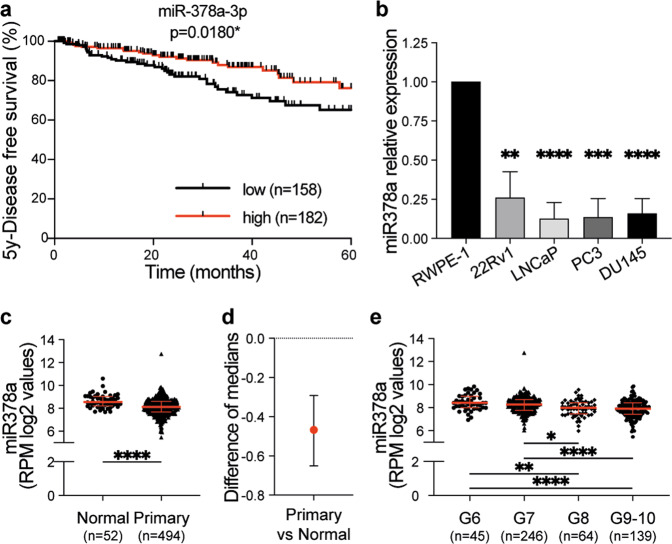
Fig. 2. MiR-378a expression is reduced in advanced prostate cancer.
a Kaplan–Meier plot showing 5-years disease-free survival of TCGA PCa patients with localised disease (N0) grouped according to miR-378a-3p expression (log2 RPM). The average expression at baseline was used to assign patients to “low” (below average) or “high” (above average) subgroups. The number of patients (n) in each group is indicated. *p = 0.018; 95% CI = 1.9 (1.1–3.2); Mantel–Cox test. b Graph showing miR-378a expression normalised to Rnu6b in 22Rv1, LNCaP, PC3 and DU145 PCa cell lines relative to RWPE-1 cells (fold from comparative Ct of RT-qPCR). Data are from three independent biological replicates each performed in technical duplicates and show mean ± SD; **p ≤ 0.01, ***p ≤ 0.001, ****p ≤ 0.0001; unpaired Student’s t test. c Graph showing miR-378a expression (log2 RPM) in normal prostate and primary prostate tumour from the TCGA dataset. Data is displayed as the median with the interquartile range. ****p ≤ 0.0001; 95% CI; unpaired two-tailed Mann–Whitney test. d Graph showing the difference of medians between the primary tumours and the normal tissues from the TCGA dataset. ****p ≤ 0.0001; 95% CI; unpaired two-tailed Mann–Whitney test. e Graph showing miR-378a expression (log2 RPM) in primary prostate tumour from the TCGA dataset according to Gleason score (G6: Gleason 6; G7: Gleason 7; G8: Gleason 8; G9–10: Gleason 9 and Gleason 10). Data is displayed as the median with the interquartile range. Comparisons between multiple groups were performed by applying a non-parametric Kruskal–Wallis test with Dunn’s correction for multiple comparisons (significance level of 0.05; *adjusted p ≤ 0.05, **adjusted p ≤ 0.01,****adjusted p ≤ 0.0001).

