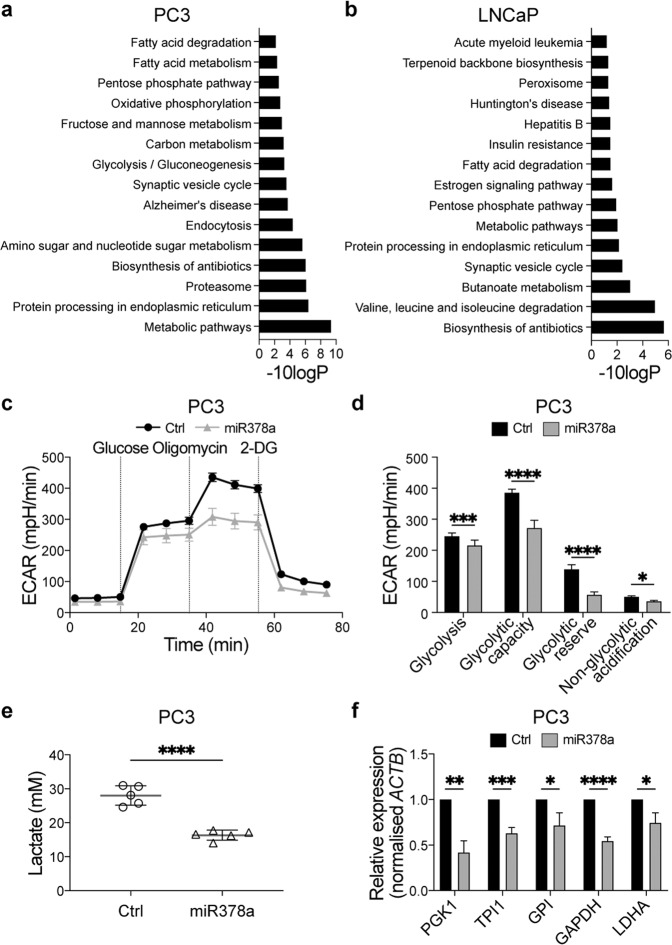
Fig. 3. MiR-378a regulates prostate cancer cell metabolism.
Top 15 deregulated pathways in PC3 cells (a) and LNCaP cells (b) from TMT-Mass spectrometry. Analysis was performed at 72 h after transfection with a miR-378a-mimic or a non-targeting control. Differentially expressed proteins were filtered using a cut-off of “unique-peptides/number-of-peptides” ratio ≥0.25 and a PEAKS significance value ≥10. Pathway analysis was performed with the David Functional annotation tool (default settings used - version 6.8) and the KEGG dataset. c Graph showing extracellular acidification rate (ECAR) in PC3 cells 72 h after transfection with a miR-378a-mimic or non-targeting control (Ctrl) and challenged with glucose (10 mM), oligomycin (1 µM) and 2-DG (50 mM). Values are normalised to total protein content. d Quantification of the glyco-stress test parameters in PC3 cells from the normalised ECAR values from (c). One representative experiment out of three independent biological replicates with ten technical replicates each is shown as mean ± SD; *adjusted p ≤ 0.05, ****adjusted p ≤ 0.0001; unpaired parametric Student’s t test using the Holm–Sidak method to correct for multiple comparisons (α = 0.05). e Quantification of extracellular lactate in PC3 cells 72 h after transfection with a miR-378a-mimic or non-targeting control (Ctrl). Data are from one experiment with five technical replicates and show mean ± SD; ****p ≤ 0.0001; unpaired two-tailed Student’s t test. f Graph showing expression of mRNAs encoding glycolysis rate limiting enzymes normalised to Actb (fold from comparative Ct values) in PC3 cells 72 h after transfection with a miR-378a-mimic or non-targeting control (Ctrl). Data are from three independent biological replicates each performed in technical duplicates and show mean ± SD; *p ≤ 0.05; **p ≤ 0.01; ***p ≤ 0.001; ****p ≤ 0.0001; unpaired two-tailed Student’s t test.

