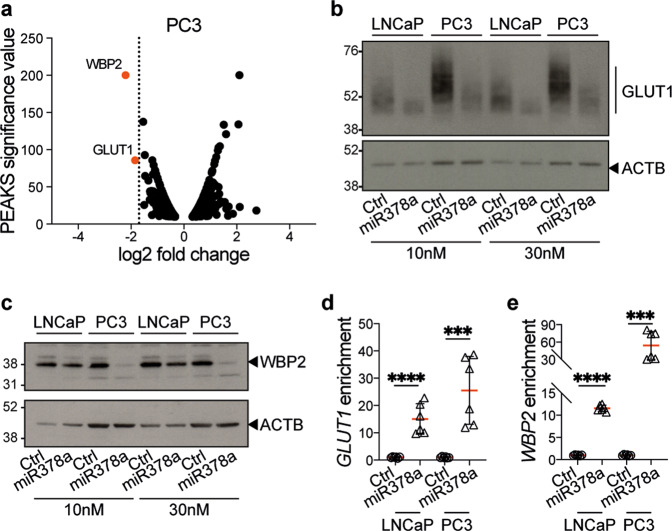
Fig. 4. MiR-378a downregulates GLUT1 and WBP2 by direct binding to their transcripts.
a Volcano plot showing significant changes (fold change) in proteins identified by mass-spectrometry in PC3 cells at 72 h after transfection with the miR-378a-mimic compared to a non-targeting control. Differentially expressed proteins were filtered using a cut-off of “unique-peptides/number-of-peptides” ratio ≥0.25 and a PEAKS significance value ≥10. Orange dots highlight the most significant downregulated proteins (WBP2, GLUT1). b Western blot for GLUT1 and ACTB as loading control in PC3 and LNCaP cells at 72 h after transfection with increasing concentrations (10 nM and 30 nM) of the miR-378a-mimic or a non-targeting control (Ctrl). c Western blot for WBP2 and ACTB as loading control in PC3 and LNCaP cells at 72 h after transfection with increasing concentrations (10 nM and 30 nM) of the miR-378a-mimic or a non-targeting control (Ctrl). Graphs showing GLUT1 (d) and WBP2 (e) mRNA levels normalised over input from miR-mRNA capture assays of PC3 or LNCaP cells at 24 h after transfection with a biotinylated miR-378a-mimic or a biotinylated non-targeting control (Ctrl). Data is the mean ± SD of two independent biological replicates, each performed as technical triplicates; ***p ≤ 0.001, ****p ≤ 0.0001; unpaired two-tailed Student’s t test.

