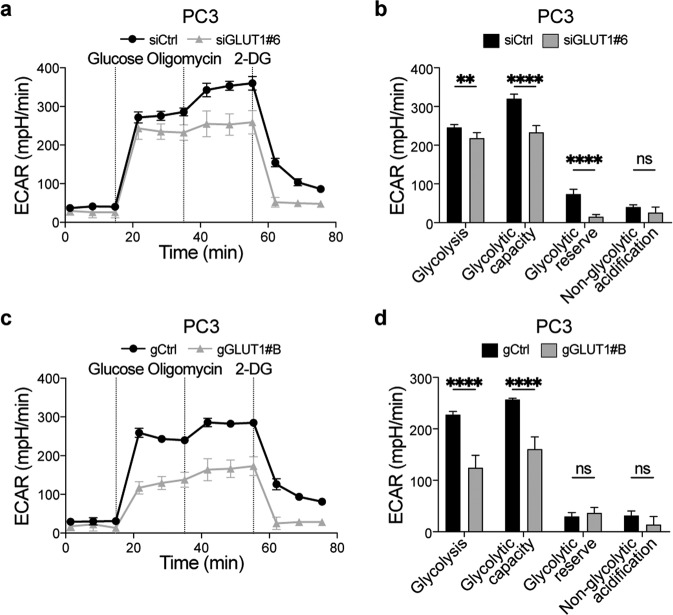
Fig. 5. GLUT1 regulates PC3 cell glycolysis and proliferation.
a Graph showing the extracellular acidification rate (ECAR) in PC3 cells at 72 h after transfection with a Glut1 targeting siRNA (siGLUT1#6) or a non-targeting control (siCTRL) and challenged with glucose (10 mM), oligomycin (1 µM) and 2-DG (50 mM) as indicated. Values are normalised to total protein content. b Quantification of the glyco-stress test parameters using normalised ECAR values relative to baseline from (a). Data displayed is from one representative experiment out of three independent biological replicates, with at least five technical replicates each. Results are displayed as mean ± SD; **adjusted p ≤ 0.01; ****adjusted p ≤ 0.0001, adjusted p = ns not significant; unpaired parametric Student’s t test using the Holm–Sidak method to correct for multiple comparisons (α = 0.05). c Graph showing the extracellular acidification rate (ECAR) in PC3 cells at 72 h after transfection with a Glut1 targeting gapmeR (gGLUT1#B) or a non-targeting control (gCtrl) and challenged with glucose (10 mM), oligomycin (1 µM) and 2-DG (50 mM) as indicated. Values are normalised to total protein content. d Quantification of the glyco-stress test parameters using normalised ECAR values relative to baseline from (c). Data displayed is from one representative experiment of three independent biological replicates with at least five technical replicates each. Results are displayed as mean ± SD; ****p ≤ 0.0001, p = ns not significant; unpaired parametric Student’s t test using the Holm–Sidak method to correct for multiple comparisons (α = 0.05).

