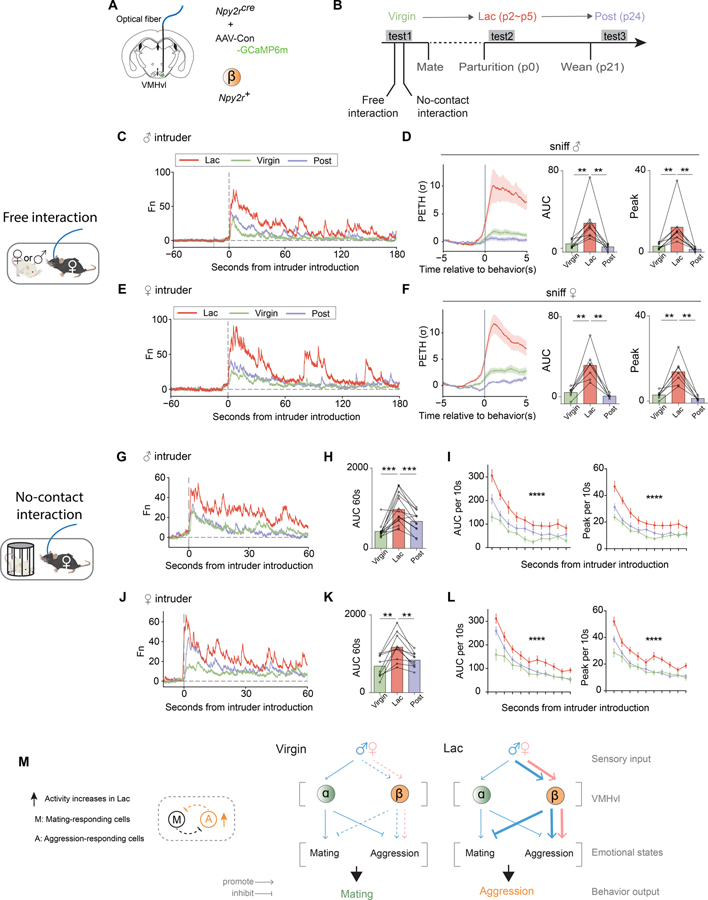
Figure 7.
Neural response of VMHvl ß cells to social cues is lactation state dependent.
(A) Schematic illustrating fiber photometry recording in VMHvl β cells.
(B) Timeline of longitudinal behavioral tests and recordings in the same individuals across their lactation cycle. Each female was tested 3 times in the virgin, lactating (Lac) and post-lactating (Post) phases. Parturition date was counted as p0.
(C, E) Representative examples of normalized GCaMP6m traces from the same individual female resident across her lactation cycle, during free interactions with (C) male or (E) female intruders.
(D, F) Left, PETHs from three phases of lactation cycle aligned to onset of sniffing of (D) male or (F) female. Right, quantification of PETH peak and AUC. No change of statistical significances after removing the highest data points in each group (see Supplemental Table 1).
(G, J) Representative of normalized GCaMP6m traces from the same individual female resident across lactation cycle during no-contact interaction with (G) male or (J) female intruder protected by an inverted pencil cup (schematic).
(H, K) AUC of neural activity recorded from three phases of lactation cycle during the first 60 seconds relative to introduction of pencil cup-protected (H) male or (K) female.
(I, L) Averaged AUC or peak of neural activity during each 10-second time bin relative to introduction of pencil cup-protected (I) male or (L) female, from the three phases of the lactation cycle.
(M) Left, Model 3 II, related to Figure 1B. Right, schematic illustrating the information flow during social interaction in virgin and lactating females: from sensory inputs to brain circuits to emotional states to behavioral output. Line thickness represents information strength. Blue: male intruder; Pink: female intruder.
**p<0.01, ***p<0.001; Mean ± SEM.

