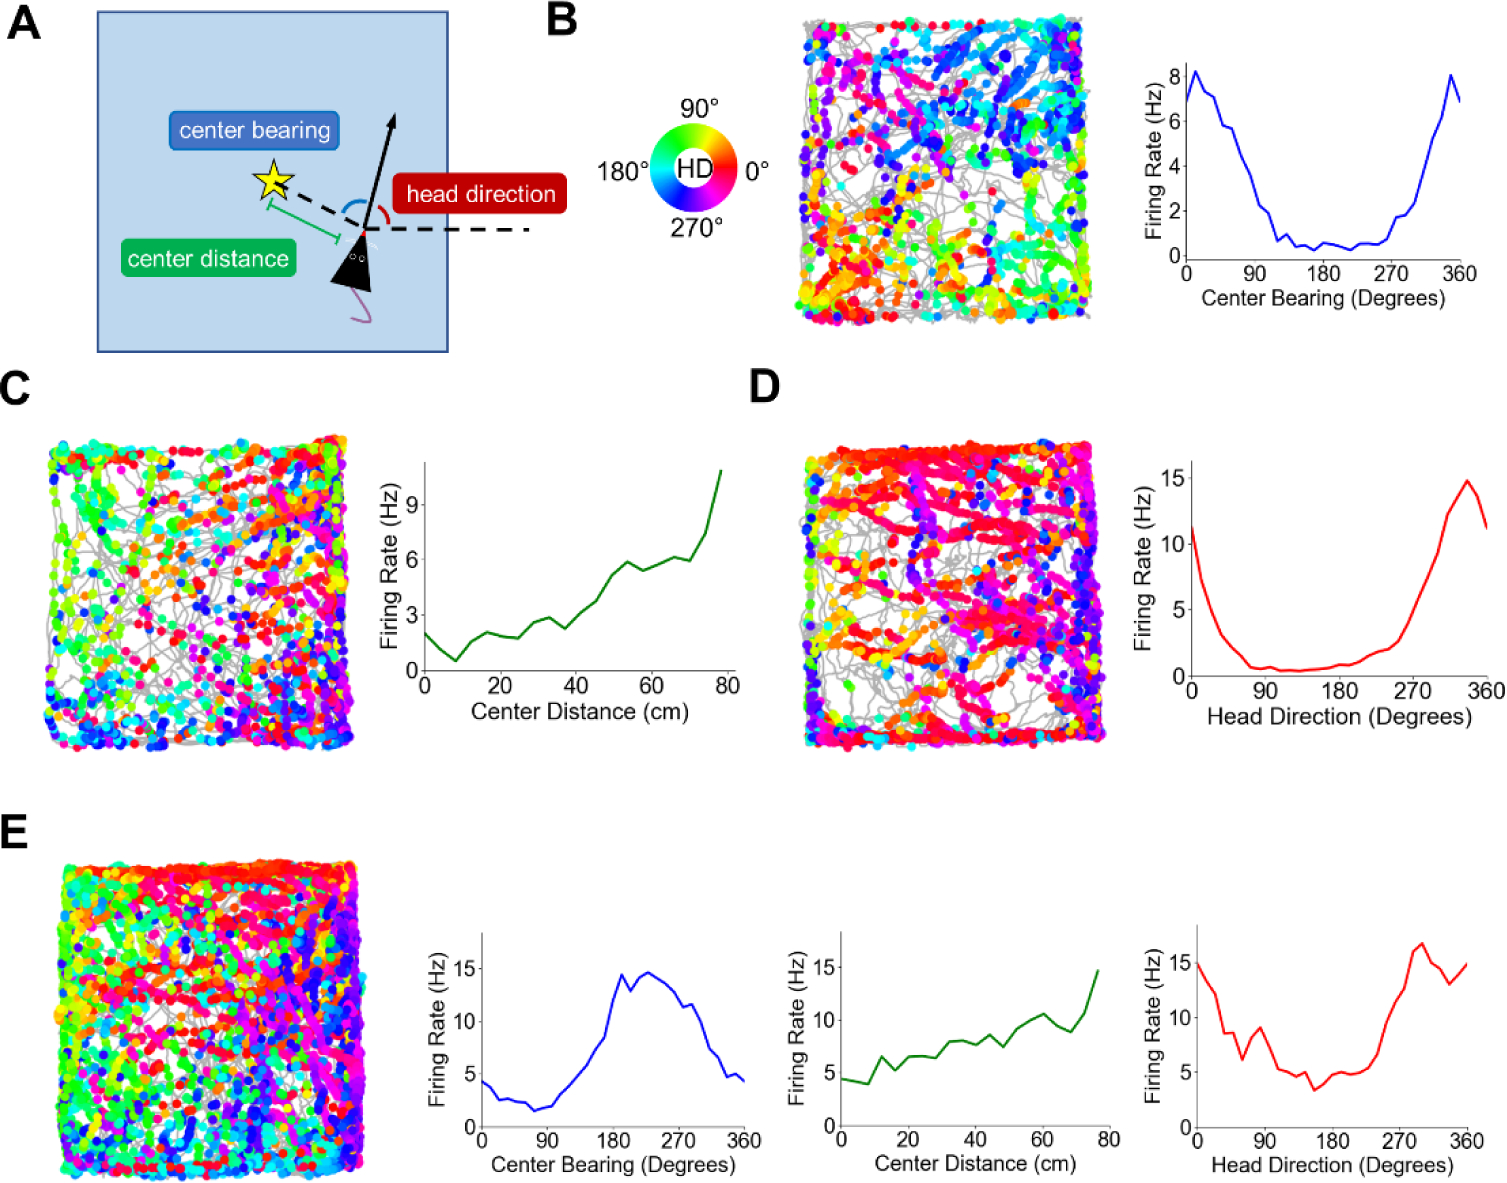
Figure 1 –

Egocentric and allocentric spatial correlates in POR. A) Schematic top-down view of the recording arena defining egocentric and allocentric spatial variables encoded by POR cells. Star represents the geometric centroid of the environment. B) Directional spike plot and center-bearing tuning curve for an example POR center-bearing cell. The gray trace represents the path of the animal during the recording session, while the dots represent locations where the cell fired a spike. Dots are colored according to the animal’s allocentric head direction when the spike was fired (color wheel on left). C) Directional spike plot and center-distance tuning curve for an example POR center-distance cell. Note the approximately linear increase in firing rate with distance from the centroid. D) Directional spike plot and head direction tuning curve for an example POR HD cell. E) Directional spike plot and tuning curves for a POR cell that showed conjunctive tuning to multiple variables. Figure modified from LaChance et al., 2019.
