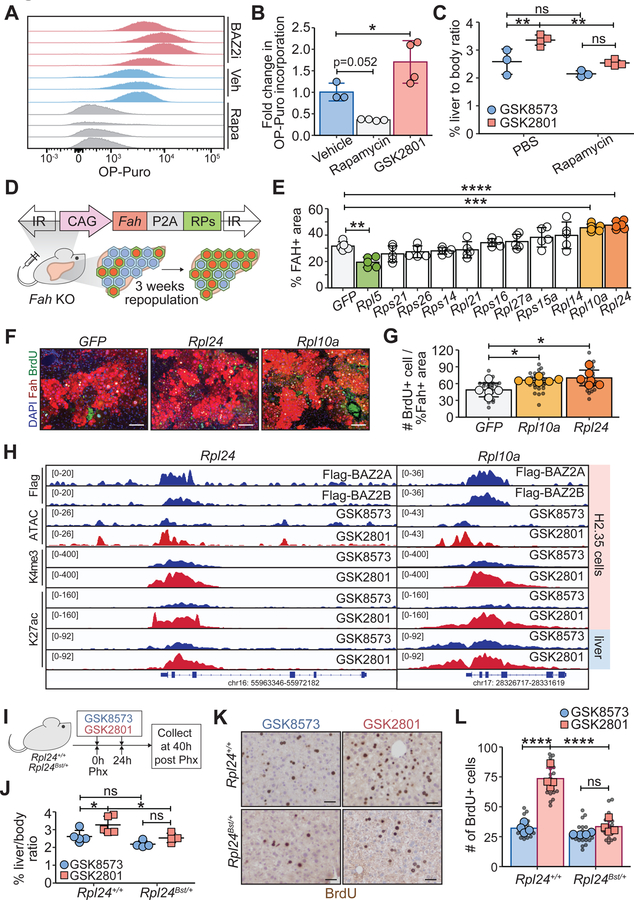
Figure 7. Enhanced regeneration with BAZ2 inhibition was caused by increased protein synthesis rates.
A. Flow cytometry analysis of OP-puro incorporation in 48h-post-PHx mouse livers treated with vehicle, GSK2801, or rapamycin.
B. OP-puro quantification in hepatocytes (n = 3, 4, 4 mice).
C. Liver to body weight ratios 48 hours after 70% PHx (n = 3, 4, 3, 4 mice) in mice treated with PBS or 2.0 mg/kg of rapamycin. Small molecules were given to mice at the time of surgery and dosed every day x2 before tissue collection.
D. Schema showing the effect of overexpressing individual ribosomal proteins on hepatocyte repopulation in Fah KO mice.
E. Percent FAH+ area in ribosomal protein overexpression experiments from Figure S7B. FAH+ areas in each mouse were averaged from five 10X images.
F. Representative composite IF images of FAH and BrdU in mice with Rpl10a or Rpl24 overexpression (scale bar = 100 μm).
G. Number of BrdU+ cells per FAH+ percent area (n = 5, 6, 6 mice). Smaller black dots represent values from single 10X images. Larger dots represent average values from five images.
H. Normalized ChIP-seq tracks showing BAZ2 protein binding, chromatin accessibility, H3K4me3, and H3K27ac for Rpl24 and Rpl10a loci in H2.35 cells and in regenerating livers.
I. Schema of the experiment to determine the effect of reduced protein synthesis on BAZ2 inhibition. Two doses of GSK8573 or GSK2801 were given to Rpl24+/+ and Rpl24Bst/+ mice before and after surgery.
J. Liver to body weight ratios of Rpl24+/+ and Rpl24Bst/+ mice receiving GSK8573 and GSK2801, 40 hours after PHx (Rpl24+/+: n = 5, 5 mice; Rpl24Bst/+: n = 4, 4 mice).
K. BrdU staining 40 hours after PHx (scale bar = 50 μm).
L. Quantification of BrdU incorporation from K (Rpl24+/+: n = 4, 4 mice; Rpl24Bst/+: n = 4, 4 mice). Smaller black dots represent the number of BrdU+ cells from each 10X image. Larger dots represent the number of BrdU+ hepatocytes for each mouse averaged from five images.

