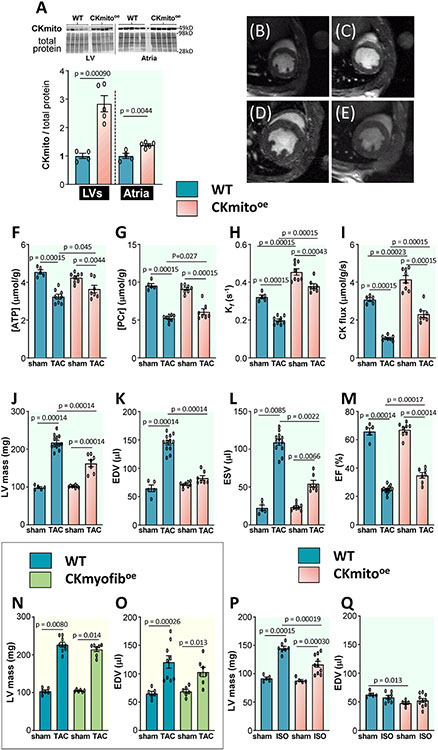
Figure 2. Cardiac-specific overexpression of mitochondrial creatine kinase (CKmito) improves in vivo cardiac energetics and attenuates pathologic remodeling in failing murine hearts.
Tissues were isolated from WT and cardiac-specific CKmito overexpressing (CKmitooe) mice. (A) Expression levels of CKmito were normalized to total protein and presented as relative to the amount of CKmito detected in WT hearts (experimental replicates: n=4 (WT LV or atria), n=5 (CKmito LV or atria)). Representative transverse in vivo 1H MRI of mice at the mid-left ventricle showing (B) WT sham, (C) CKmitooe sham, (D) WT TAC, and (E) CKmitooe TAC. In vivo cardiac 31P MRS and MRI measures of (F) ATP and (G) phosphocreatine (PCr) levels; (H) CK forward pseudo-first-order rate constant (Kf); (I) CK flux; (J) left ventricular (LV) mass; (K) end-diastolic volume (EDV); (L) end-systolic volume (ESV); and (M) ejection fraction (EF) for WT or CKmitooe mice with or without TAC (experimental replicates: n=5 (WT sham), n=8 (WT TAC or CKmitooe sham), and n=7 (CKmitooe TAC) for F-I and n=5 (WT sham), n=12 (WT TAC), n=8 (CKmitooe sham), and n=7 (CKmitooe TAC) for J-M), (N) LV mass and (O) EDV for WT or cardiac-specific myofibrillar CK overexpressing (CKmyofiboe) mice with or without TAC (experimental replicates: n=6 (WT sham or CKmyofiboe sham), n=9 (WT TAC), n=7 (CKmyofiboe TAC)); and (P) LV mass, and (Q) EDV for WT or CKmitooe mice following chronic isoproterenol (ISO) or saline infusion (experimental replicates: n=5 (WT saline or CKmitooe saline), n=7 (WT ISO), and n=10 (CKmitooe ISO)). Graphs show data points for individual mice. Data were tested for normality using the Kolmogorov-Smirnov test for normality and analyzed by two-tailed Student’s t-test (A), two-way ANOVA followed by Tukey’s post-hoc multiple comparison tests (F-K, M, O-Q), or Wilcoxon signed rank test followed by pair-wise, two-sided multiple comparison analysis (Dwass, Steel, Crichlow-Fligner Method) (L, N). The error bars represent ±SEM.

