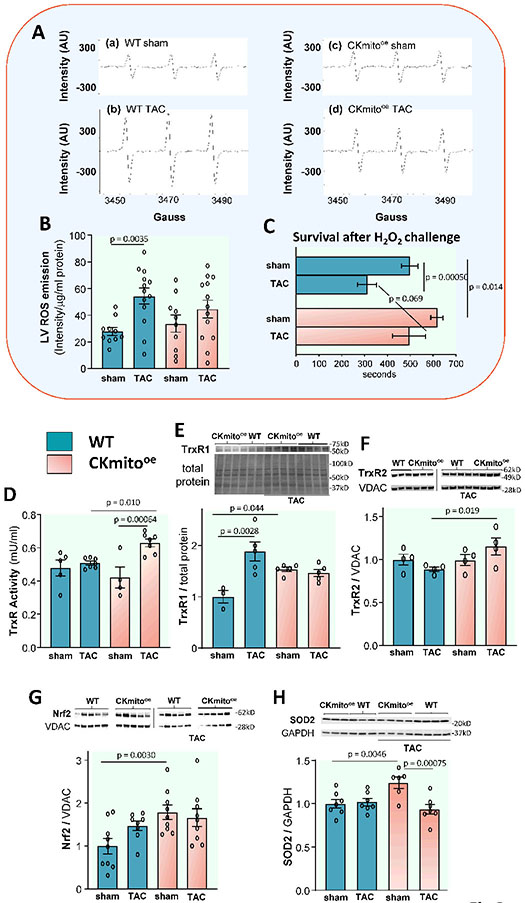
Figure 3. Cardiac-specific overexpression of mitochondrial creatine kinase (CKmito) attenuates reactive oxygen species (ROS) due to TAC heart failure.
(A) Representative electron paramagnetic resonance (EPR) spectra showing oxygen-derived free radicals detected in left ventricles (LV) from WT (a) sham or (b) TAC hearts, and LVs from cardiac-specific CKmito overexpressing (CKmitooe) (c) sham or (d) TAC hearts. (B) ROS production measured by EPR in LVs of WT or CKmitooe sham or TAC hearts (experimental replicates: n=10 (WT sham or CKmitooe sham) and n=13 (WT TAC or CKmitooe TAC)). (C) Cardiomyocytes isolated from WT‡ or CKmitooe sham or TAC hearts were exposed to H2O2 (50 μM) for 700 s, and the time to irreversible arrhythmia/cell death was monitored (experimental replicates: n=20 cells isolated from 6 mice (WT sham), n=6 cells isolated from 2 mice (WT TAC), n=20 cells isolated from 5 mice (CKmitooe sham), and n=10 cells isolated from 4 mice (CKmitooe TAC)). Note that the same WT cardiomyocytes were employed for Fig 3C and Supplement Figure S4E since the experiments were conducted on the same day and under the same experimental conditions. (D) Thioredoxin reductase (TrxR) activities determined in WT or CKmitooe sham or TAC heart LV homogenates in the presence of excess NADPH (experimental replicates: n=5 (WT sham), n=7 (WT TAC or CKmito TAC), and n=4 (CKmito sham)). Representative immunoblots and summary of data showing LV expression levels of: (E) TrxR1; (F) TrxR2; (G) Nrf2 (nuclear factor erythroid 2-related factor 2); and (H) SOD2 (superoxide dismutase 2) normalized to total protein, GAPDH (glyceraldehyde 3-phosphate dehydrogenase), or VDAC (voltage-dependent anion channel) and presented as relative to the amount of protein detected in sham WT hearts (experimental replicates: n=3 (WT sham) and n=5 (WT TAC, CKmito sham, or CKmito TAC) (E); n=4 per group (F); n=9 (WT sham, CKmito sham, or CKmito TAC) and n=8 (WT TAC) (G); n=7 (WT sham, WT TAC, or CKmito TAC) and n=6 (CKmito sham) (H). Graphs show data points for individual mice (B, D-H). Data were tested for normality using the Kolmogorov-Smirnov test and analyzed by two-way ANOVA followed by Tukey’s post-hoc multiple comparison test (B, D-H) while a generalized estimating equation model was used to take into account the correlation of within-subject data (C). The error bars represent ±SEM.

