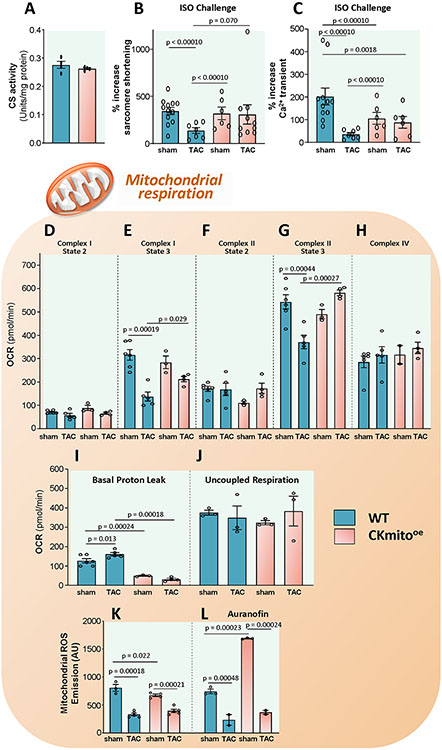
Figure 4. Cardiac-specific overexpression of mitochondrial creatine kinase (CKmito) improves isolated mitochondrial function and reduces proton leak.
(A) Citrate synthase (CS) activities, an index of total mitochondrial mass, analyzed in WT, and cardiac-specific CKmito overexpressing (CKmitooe) heart lysates (n=4 per group). Cardiomyocytes isolated from WT or CKmitooe sham or TAC hearts were stimulated with isoproterenol (ISO, 2.5 nM, 10 min) and percent increase in: (B) sarcomere shortening and (C) Ca2+ transients were monitored (experimental replicates: n=12 cells isolated from 3 mice (WT sham), n=7 cells isolated from 2 mice (WT TAC), n=6 cells isolated from 2 mice (CKmitooe sham), and n=10 cells isolated from 6 mice (CKmitooe TAC) cells (B) and n=11 cells isolated from 3 mice (WT sham), n=7 cells isolated from 2 mice (WT TAC), n=6 cells isolated from 2 mice (CKmitooe sham), and n=6 cells isolated from 2 mice (CKmitooe TAC) (C)). Mitochondria were isolated from WT and CKmitooe sham or TAC hearts. Summary of data showing oxygen consumption rate (OCR) for: (D) complex I state 2; (E) complex I state 3; (F) complex II state 2; (G) complex II state 3; and (H) complex IV; (I) basal proton leak; and (J) uncoupled respiration (experimental replicates: n=6 (WT sham), n=5 (WT TAC), n=3 (CKmito sham), and n=4 (CKmito TAC) (D-G, I); n=6 (WT sham), n=5 (WT TAC), n=2 (CKmito sham), and n=4 (CKmito TAC) (H); n=3 per group (J)). Mitochondrial reactive oxygen species (ROS) emission in the (K) absence or (L) presence of auranofin (20nM) (experimental replicates: n=3 (WT sham), n=5 (WT TAC or CKmito TAC), and n=4 (CKmito sham) (K); n=3 (WT sham or CKmito sham) and n=2 (WT TAC or CKmito TAC) (L)). Graphs show data points for individual mice (A, D-L) or individual cells (B, C). Data were tested for normality using the Kolmogorov-Smirnov test for normality and analyzed using a two-tailed Student’s t-test (A), a generalized estimating equation model was used to take into account the correlation of within-subject data (B, C), or two-way ANOVA followed by Tukey’s post-hoc multiple comparison test (D-L). The error bars represent ±SEM.

