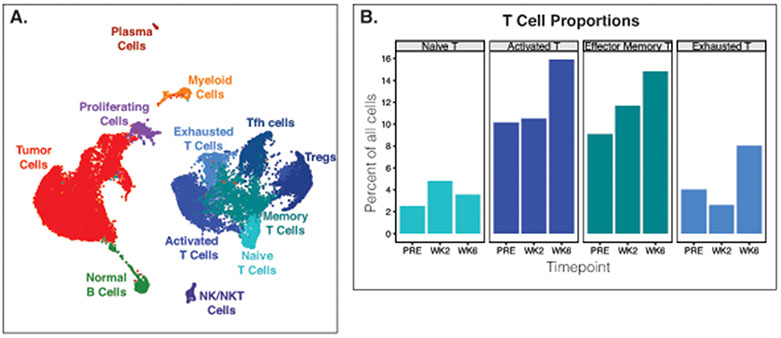
Figure 4.
Fine needle aspirates yield high quality single cell sequencing data. (A) Dimensionality reduction plot showing cells clustered by single-cell gene expression profiles. Cells from 3 fine needle aspirates from the same tumor from 3 different timepoints from one patient are combined and clustered as one dataset. (B) Frequencies of tumor T cell populations before and after treatment. PRE, pre-treatment. WK2, week 2 post-treatment. WK6, week 6 post-treatment. Tfh cells, T follicular helper. Treg, Regulatory T cells. NK/NKT cells, natural killer/natural killer T cells.

