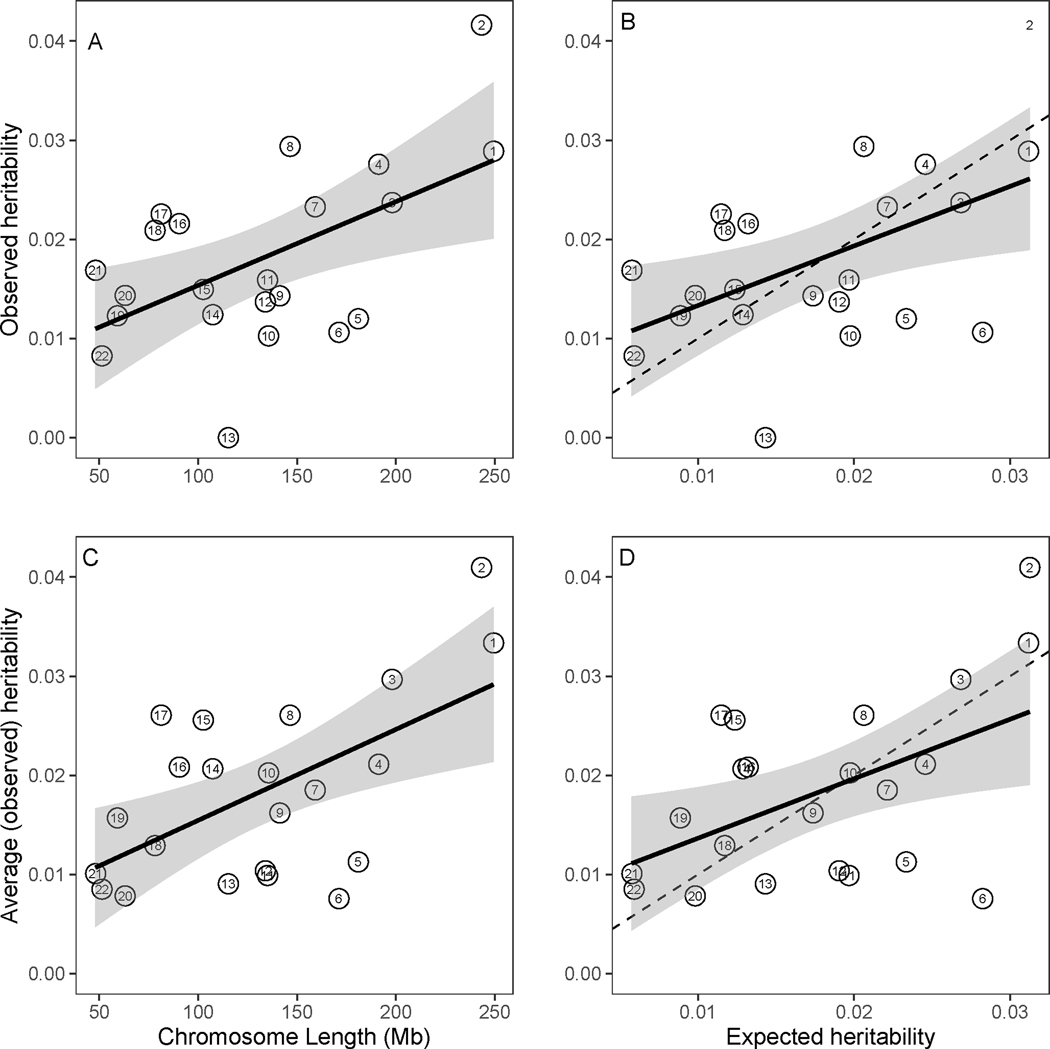
Figure 2.
Estimates of heritability partitioned by chromosome. A) The observed heritability by chromosome length and the 95% confidence interval (CI) for the regressed line (adjusted R2=0.27, p-value=0.008); B) The observed heritability by expected heritability and the 95% CI for the regressed line (adjusted R2=0.23, p-value=0.014); C) The weighted average observed heritability by chromosome length and the 95% CI for the regressed line (average over this manuscript and Davis et al. study) (adjusted R2=0.31, p-value=0.004), the results for chromosome 21 and 22 are overlapping; and D) The weighted average heritability by expected heritability and the 95% CI for the regressed line (adjusted R2=0.22, p-value=0.0161). The dashed lines have slope one and intercept zero (observed=expected).

