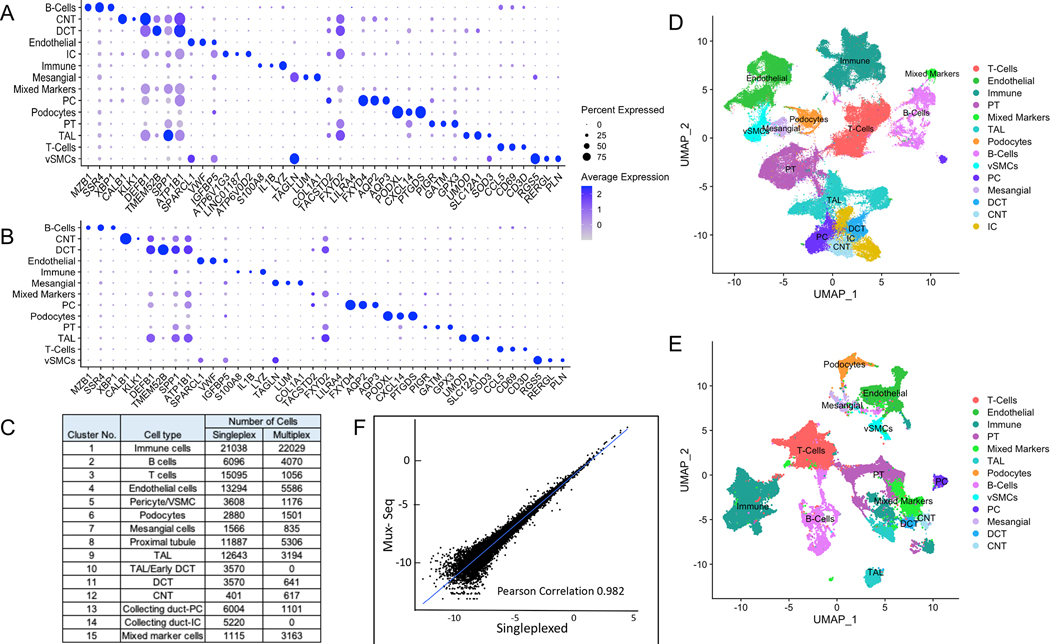
Figure 2. Single cell transcriptomic analysis of human kidney by scRNAseq reveals distinct cell populations.
(A) Single cell transcriptomes from 8 nephrectomy tissues (2 transplant and 6 native) were analyzed by conventional singleplex scRNAseq. Unsupervised clustering of 106,760 cells resulting in 38 distinct cell populations. Dot plot of average gene expression values (log scale) of top 3 unique differentially expressed markers and percentage of cells expressing these markers in each cell type are shown. (B) 50,275 single cell transcriptomes from 2 transplant and 6 native nephrectomy tissues were analyzed by pooling cells and conducting Mux-Seq. Unsupervised clustering resulted in 39 distinct cell populations. Dot plot of average gene expression values (log scale) of top 3 unique differentially expressed markers and percentage of cells expressing these markers in each cell type are shown. (C) Table listing cell type annotations and number of cells. (D) UMAP plot showing distinct cell populations identified in (C) from singleplex data analysis and clustering. (E) UMAP plot showing distinct cell populations identified in (C) for multiplex analysis. (F) Scatterplot of log transformed average gene expression obtained by Mux-Seq (on y-axis) and singleplex-scRNAseq (on x-axis). Only genes expressed in at least five cells in each assay were considered. Pearson coefficient = 0.982.

