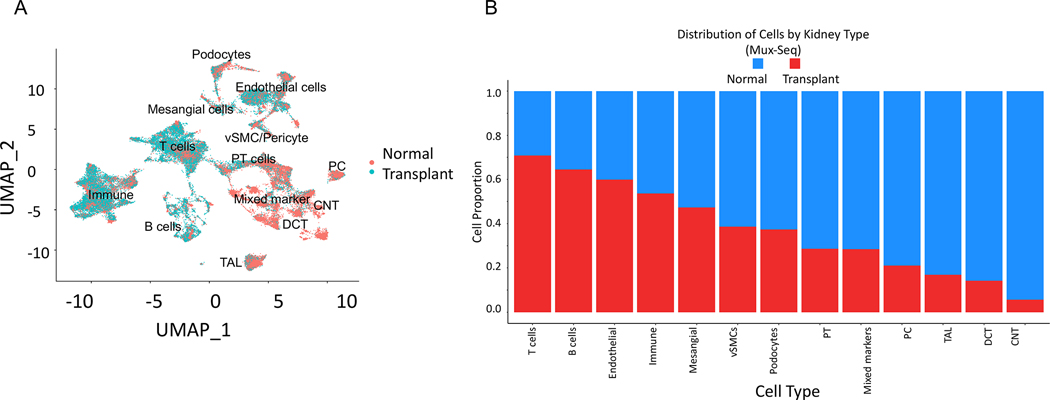
Figure 3. Mux-Seq analysis shows distinct gene expression profiles for cells obtained from transplant nephrectomies versus normal tissue.
(A) UMAP plot of cells from 6 normal (25,470 cells) and 2 transplant nephrectomies (24,805 cells) shows separate clustering of transplant versus normal cells. Cells from the two groups are indicated by different colors (red, normal; blue, transplant). (B) Bar graph displays proportion of cells in each cluster from transplant versus normal tissue.

