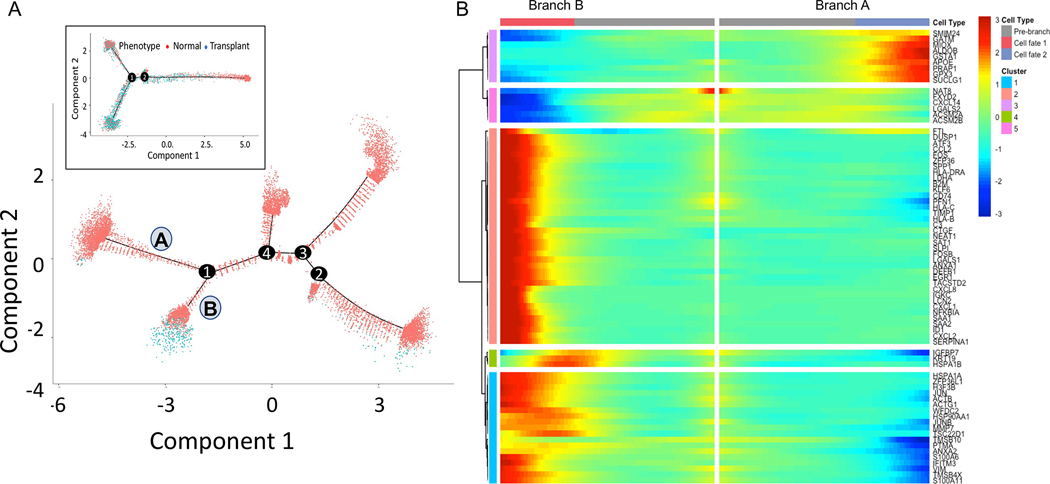
Figure 4. Trajectory analysis of Proximal Tubule cells using Monocle pseudotime.
Cell trajectory plot shows all cells from singleplex ordered by A) Cellular phenotype. B) Heatmap of the top genes most significantly associated with pseudotime at branch point 1. Branch A has 2,780 cells from normal and only 17 cells from transplant explants. Branch B has a higher proportion of cells from transplant explants (1,219 normal and 289 transplant). Inset in A shows the cell trajectory with Mux-Seq dataset.

