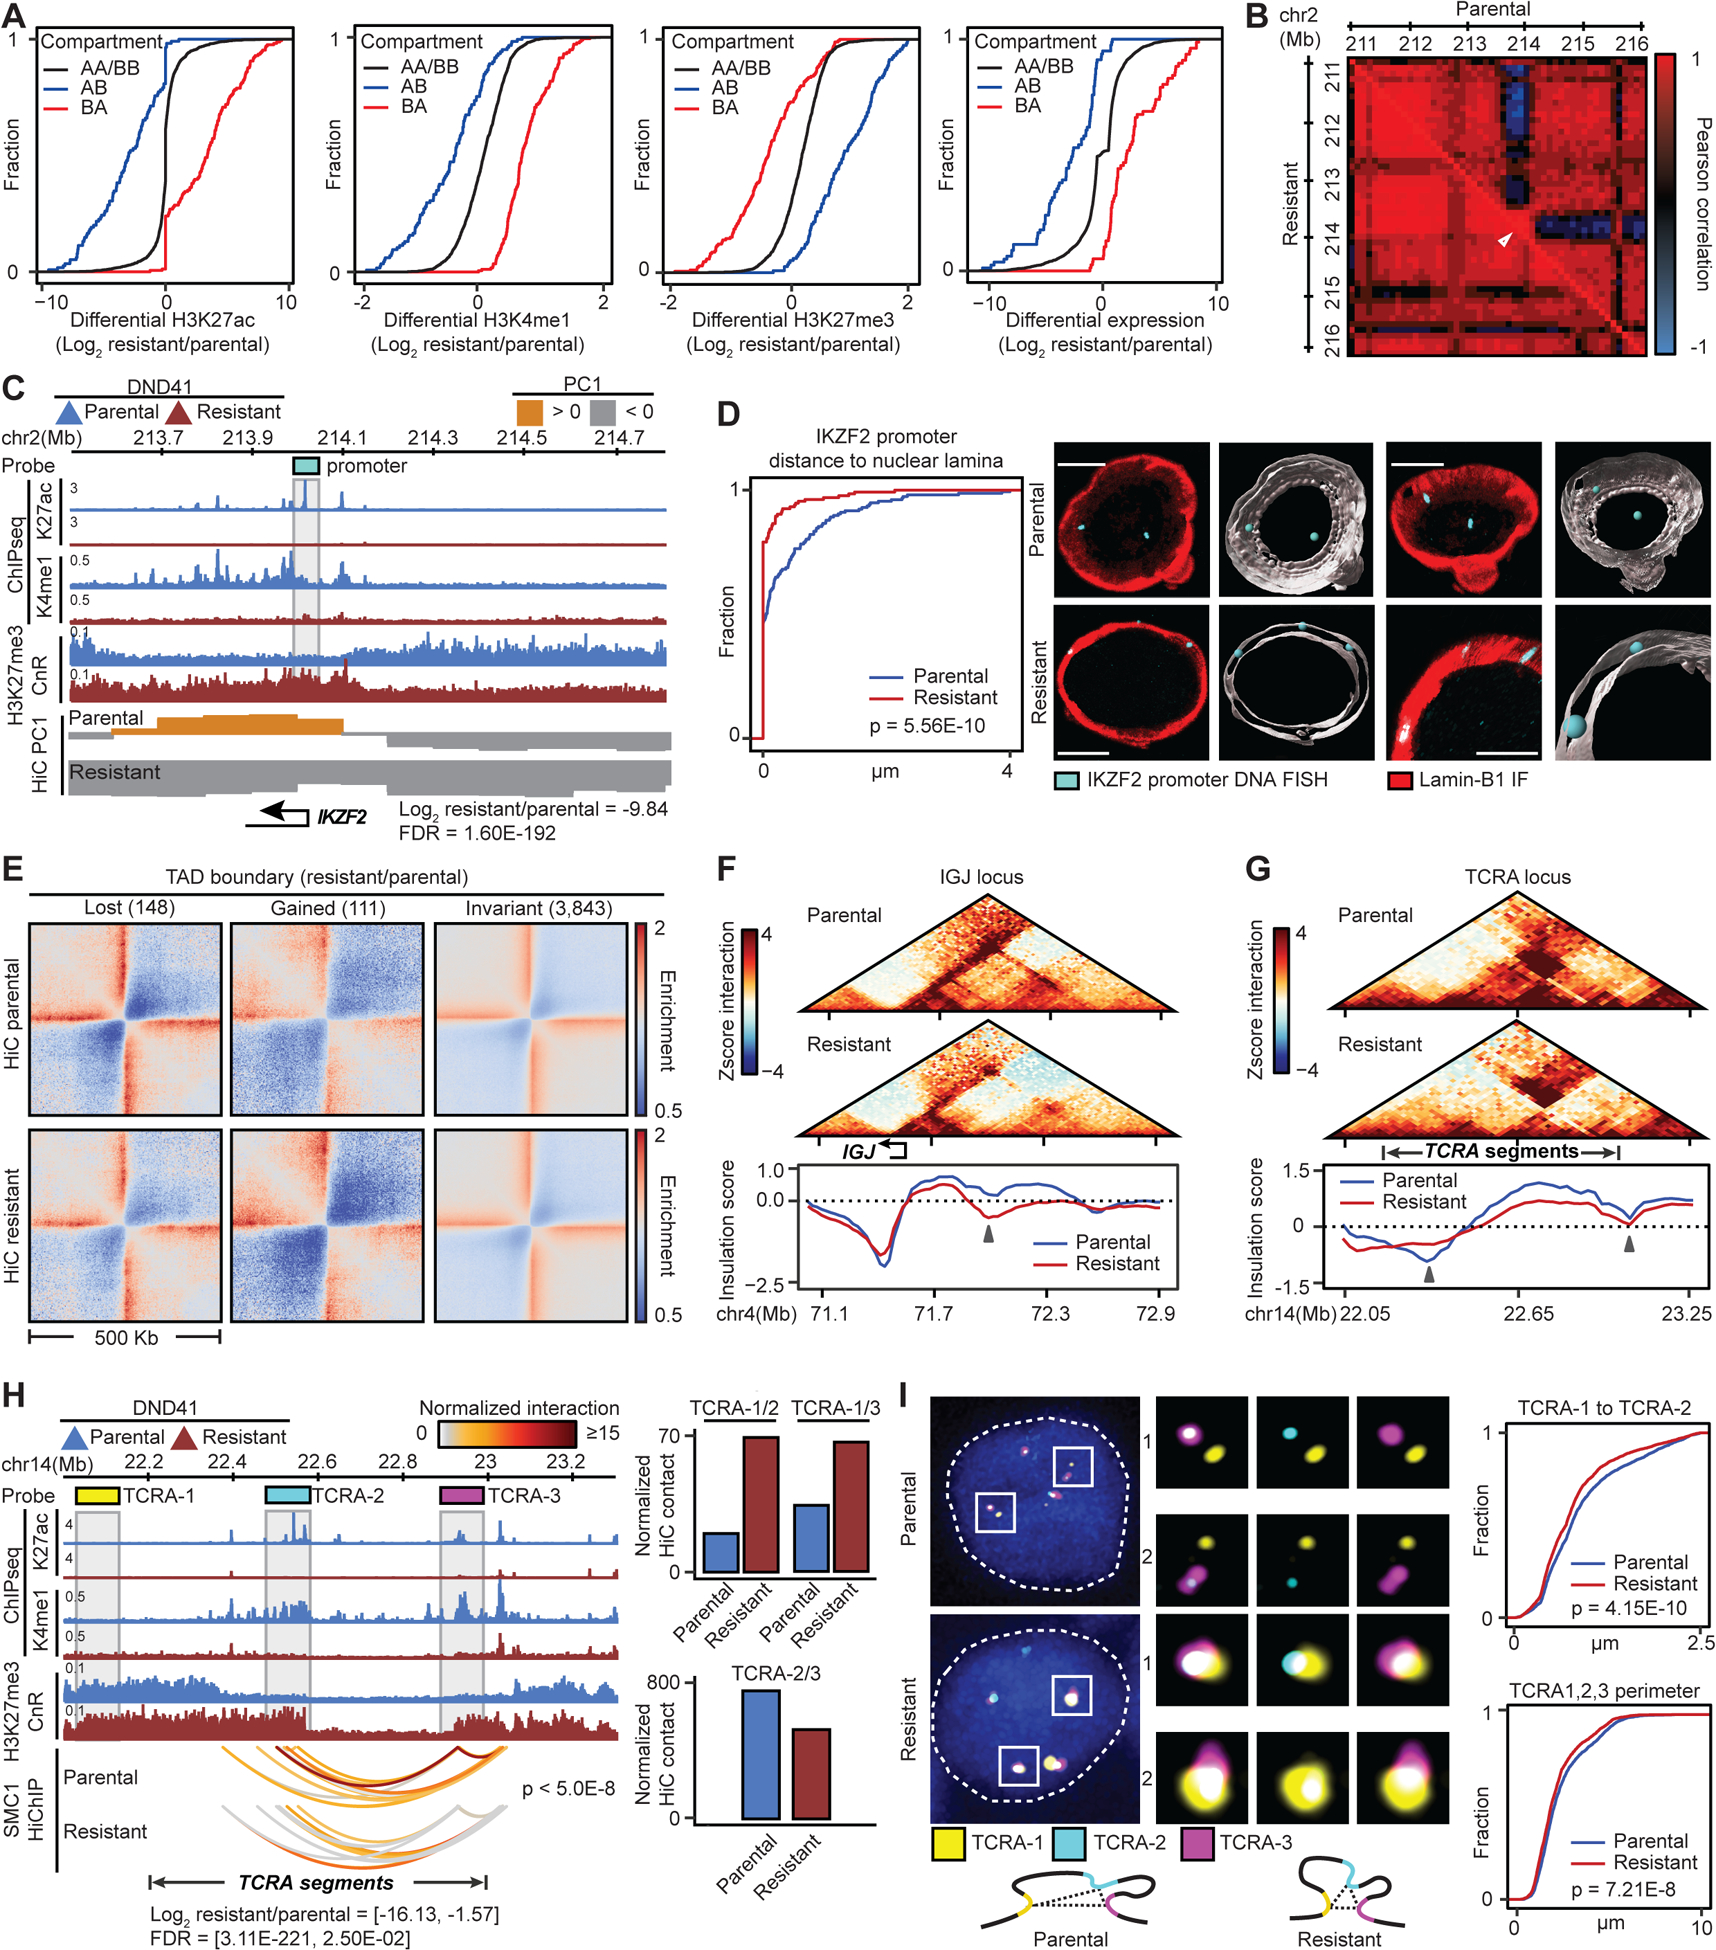
Figure 1: Chromatin compartments and TADs are reorganized in GSI-resistant T-ALL.

(A) Histone marks and gene expression changes at loci with compartment switching in GSI-resistant DND41.
(B, C) IKZF2 contact frequency Pearson correlation matrix (B), its PC1, expression and histone marks (C) in parental and resistant cells. Gray box: Oligopaint probes.
(D) Left: Distributions of distance between IKZF2 and nuclear envelope in resistant vs parental cells (KS test) with mean (+/− SD) of 0.087 (+/− 0.27) and 0.36 (+/− 0.64) μm, respectively. Right: representative and Imaris-modeled cells.
(E) Pileup HiC maps at TAD boundaries per insulation score change.
(F, G) Examples of TAD boundary insulation gain (F) or loss (G) in resistant cells marked by arrows.
(H) Changes in histone marks, looping (paired t-test), and expression of TCRA gene segments. Gray boxes: Oligopaint probes. Right: HiC signal between the noted probes.
(I) Distributions of TCRA-1 to TCRA-2 distance (right, top) and TCRA-1, TCRA-2 and TCRA-3 spatial perimeter (right, bottom) (model: left, bottom) in resistant vs parental cells (KS test). Parental (resistant) mean (+/− SD) distance and perimeter: 0.92 (+/− 0.57) (0.81 (+/− 0.53)) and 2.46 (+/− 1.40) (2.20 (+/− 1.25)) μm, respectively. Left: representative cells. Blue: DAPI.
