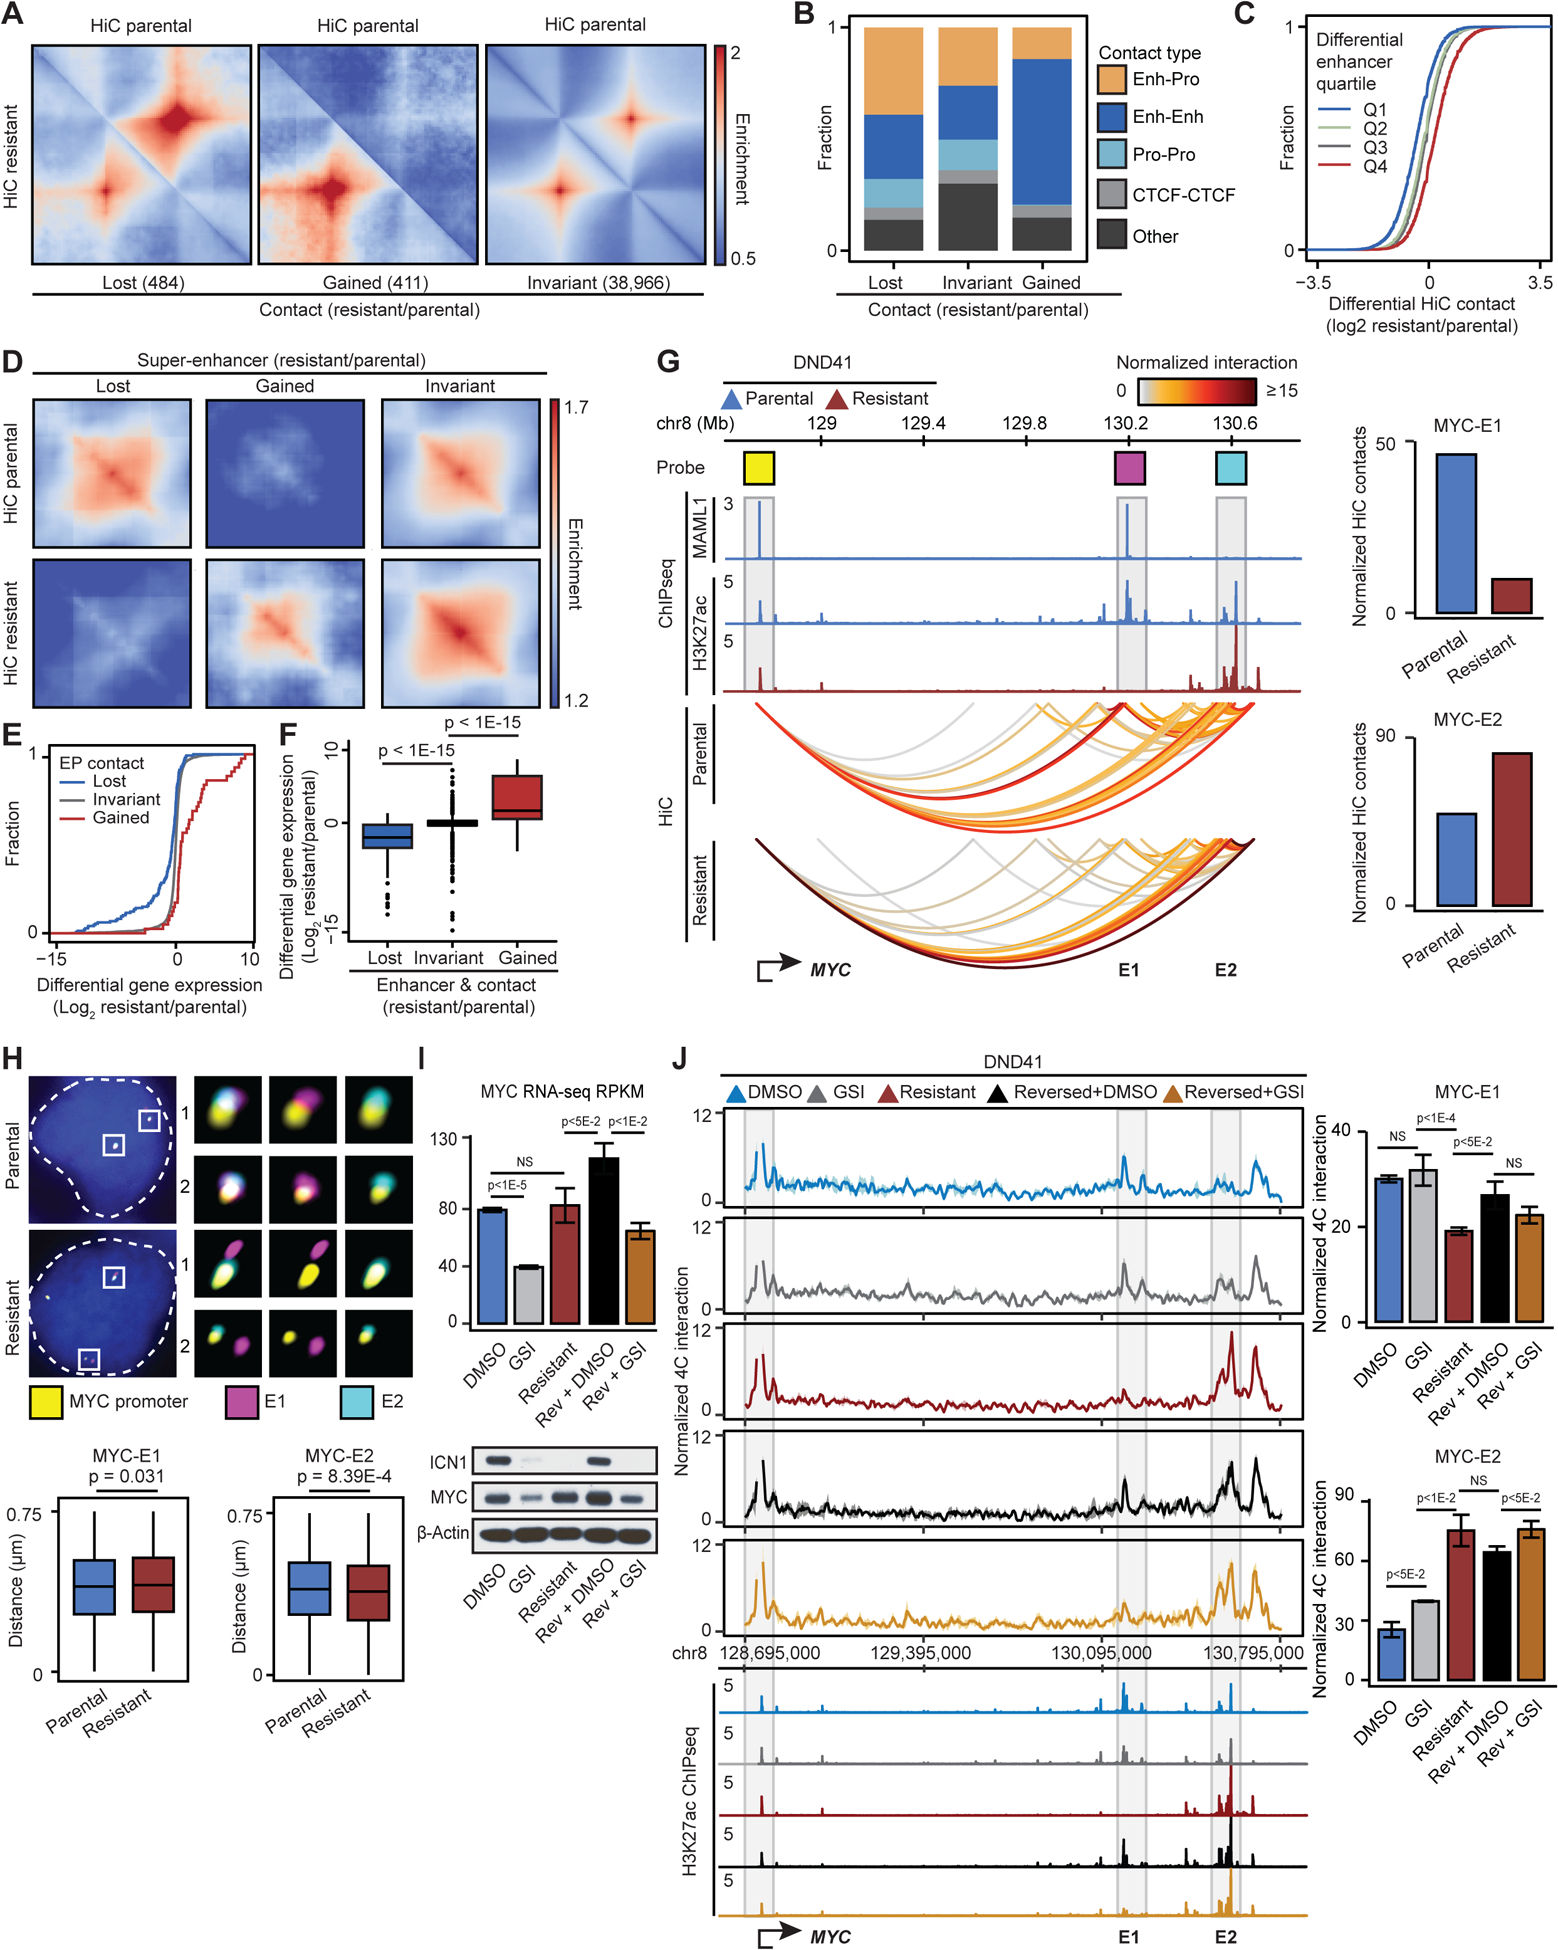
Figure 2: GSI-resistance restructures enhancer-promoter loops.

(A) Pileup HiC maps at loops per interaction frequency change.
(B) Fraction of classes of genomic elements connected to differential loops. Enh: Enhancer, Pro: Promoter.
(C) HiC changes per quartile of differential H3K27ac on connected enhancers.
(D) Pileup HiC maps at SEs per H3K27ac change.
(E) Differential expression distribution per connected enhancer-promoter (EP) loop change.
(F) Differential expression per enhancer activity and EP contact change (Wilcoxon test).
(G) Left: Notch-bound (MAML1) E1 SE (magenta), Notch-unbound E2 SE (cyan) and MYC promoter (yellow) Oligopaint probes. Right: HiC signal between the noted probes.
(H) Bottom: distributions of distance between the noted elements in parental vs resistant cells (Wilcoxon test). Parental (resistant) MYC-E1 and MYC-E2 mean (+/− SD) distance: 0.399 (+/− 0.176) (0.407 (+/− 0.176)) and 0.401 (+/− 0.173) (0.389 (+/− 0.177)) μm. Top: representative cells. Blue: DAPI.
(I) MYC transcript (top), ICN1 and MYC protein (bottom) levels in DMSO- and GSI-treated parental, GSI-resistant, DMSO-treated reversed, and GSI-treated reversed DND41. Control: β-Actin.
(J) MYC-promoter-viewpoint UMI 4C-seq track (left), quantification (right, mean ± SD of 3 replicates) and H3K27ac per condition in (I) (t-test). NS: p>0.05.
