
Figure 3: Differential SMC1, CTCF, or YY1 loading coincides with refolded loops.
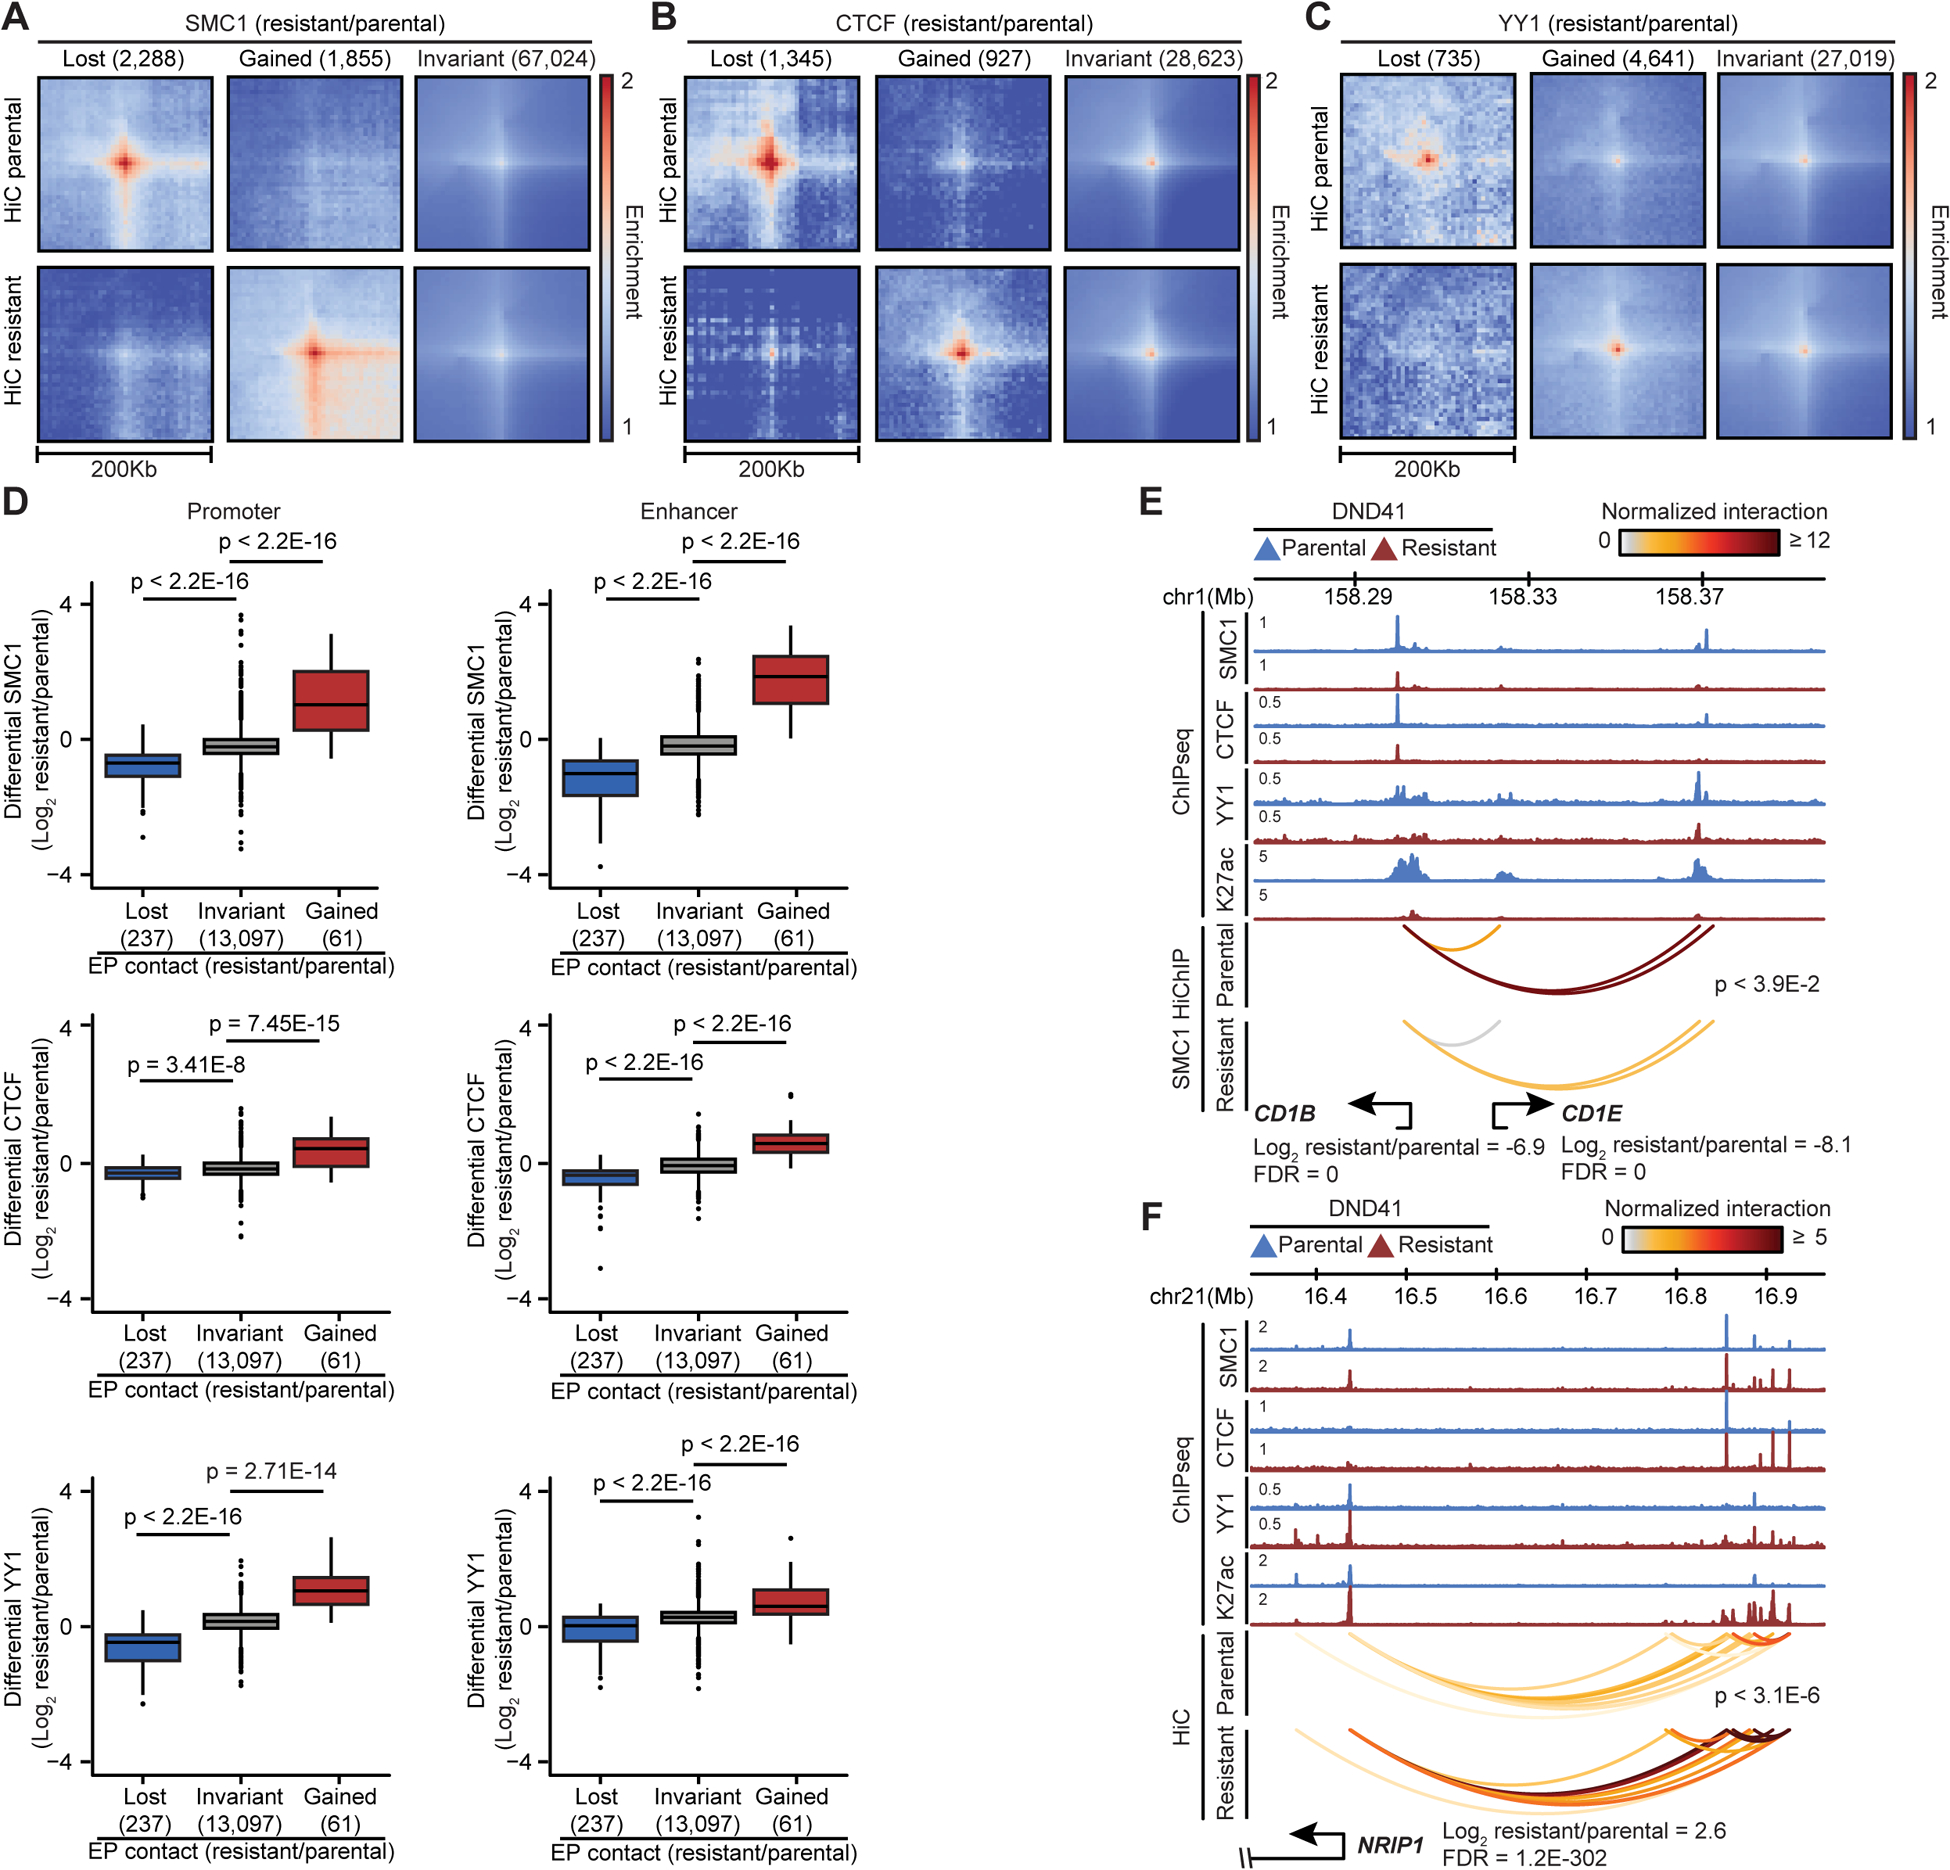
(A, B, C) Pileup HiC maps at SMC1 (A), CTCF (B) and YY1 (C) peaks per differential chromatin binding (number of events).
(D) SMC1 (top), CTCF (middle) and YY1 (bottom) loading at the connected promoters (left) and enhancers (right) per looping change (Wilcoxon test).
(E, F) Concordant changes in expression, SMC1, CTCF, YY1, H3K27ac levels, and EP loops (paired t-test).