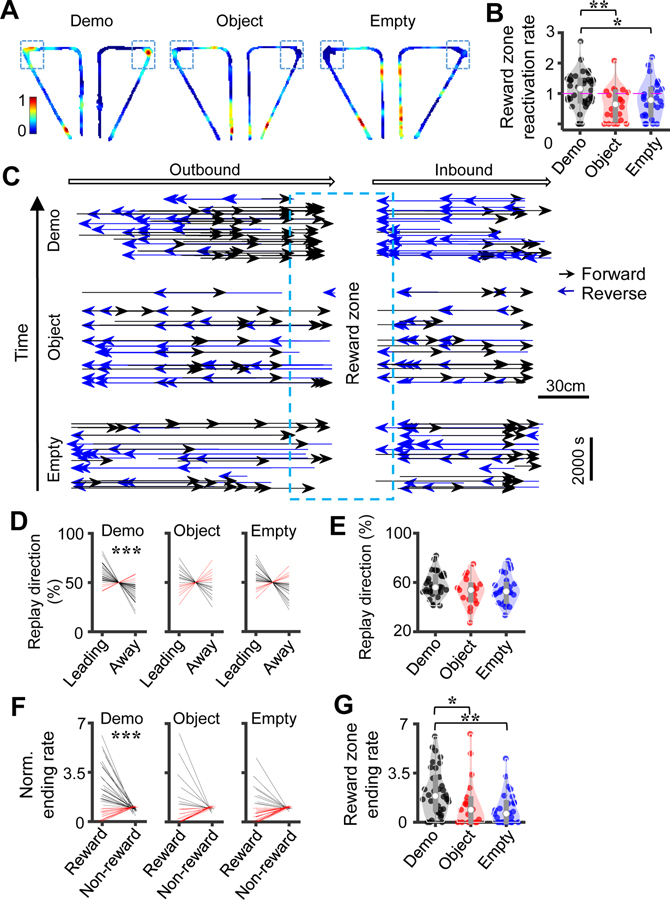
Figure 6. Remote awake replay preferred the reward sites in the maze.
(A) Reactivation spatial maps represented by spikes in PBEs in the box for the left and right trajectories in example sessions under the Demo, Object and Empty conditions. Color represents the average normalized firing rate of all active place cells. Box: reward zone.
(B) Reactivation rate in PBEs for reward zone cells. Each dot is a type of trajectory (left or right) in a session.
(C) Replay vectors on outbound and inbound trajectories (arrow: running direction) in example sessions under Demo (N = 133), Object (N = 122), and Empty (N =104), each connecting the decoded start to end positions (arrowhead: end position), sorted by replay occurring time. Note that the majority of vectors were led toward and ended at the reward zone (box) under Demo.
(D) Replay direction as measured by percentage of reward-leading and reward-away replays for all sessions under Demo, Object and Empty. Each line is a boundtype (inbound or outbound) in a session. Lines are slightly jittered along the horizontal axes for visibility. Red/black: increase/decrease in values (same in other similar plots).
(E) Comparing percentage of reward-leading replays across the 3 conditions. Each dot is a boundtype in a session.
(F) Same as (D), but for replay ending rate within the reward zone and non-reward zone. (G) Same as (E), but for replay ending rate within the reward zone and non-reward zone.
See also Figure S7.

