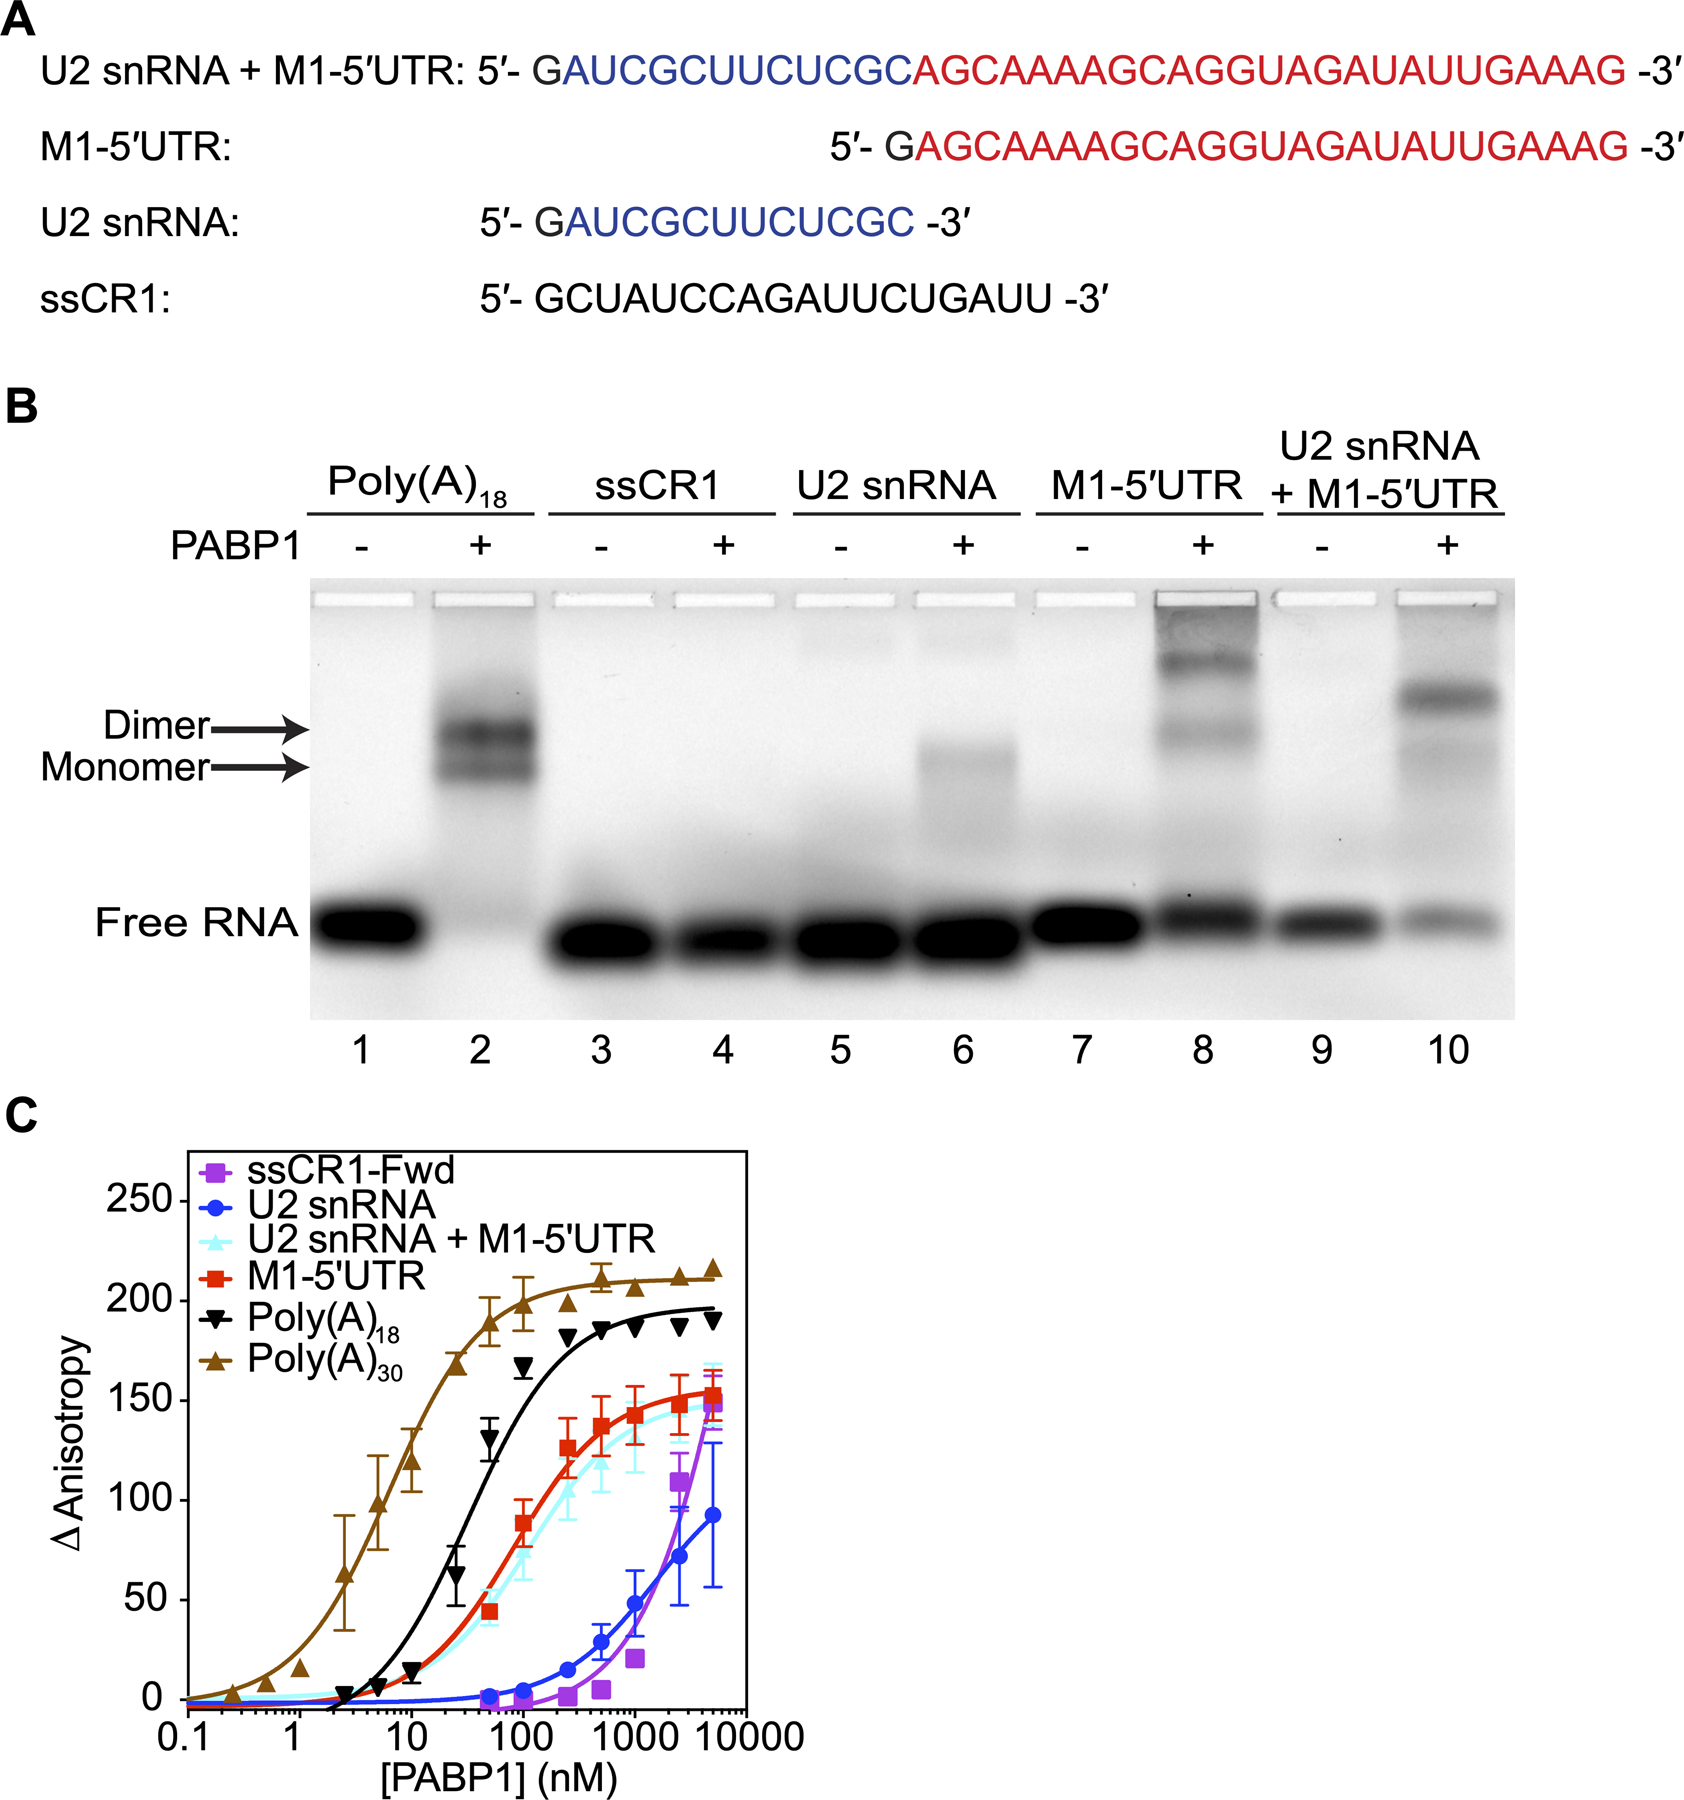
Figure 2.

PABP1 binds to the 5ʹUTR of M1 mRNA. (A) The sequences used in the binding studies. The U2 snRNA (blue) and M1–5ʹUTR (red) sequences are color coded for visual clarity. The first guanosine residue (black) is due to T7 transcription and is not part of the native sequence. (B) EMSA assay comparing the binding of PABP1 to the sections that make up the M1 5ʹUTR RNA and control RNAs. Plus sign indicates 500 nM of PABP1 was added to the reaction. Minus sign indicates no PABP1 was added to the reaction. Arrow points to the shifted PABP1 monomer•Poly(A)18 complex and PABP1 dimer•Poly(A)18 complex. (C) Anisotropy assay of PABP1 binding to the sections that make up the M1 5ʹUTR RNA and control RNAs. The final concentration of the RNAs was 1 nM [Poly(A)18, Poly(A)30, and M1–5ʹUTR] and 10 nM [ssCR1-Fwd, U2 snRNA, and U2 snRNA+M1–5ʹUTR]. The final concentration of PABP1 was increased from 0 to 5 μM. The change in anisotropy is shown on the y-axis. The error bars represent the SEM from three independent experiments.
