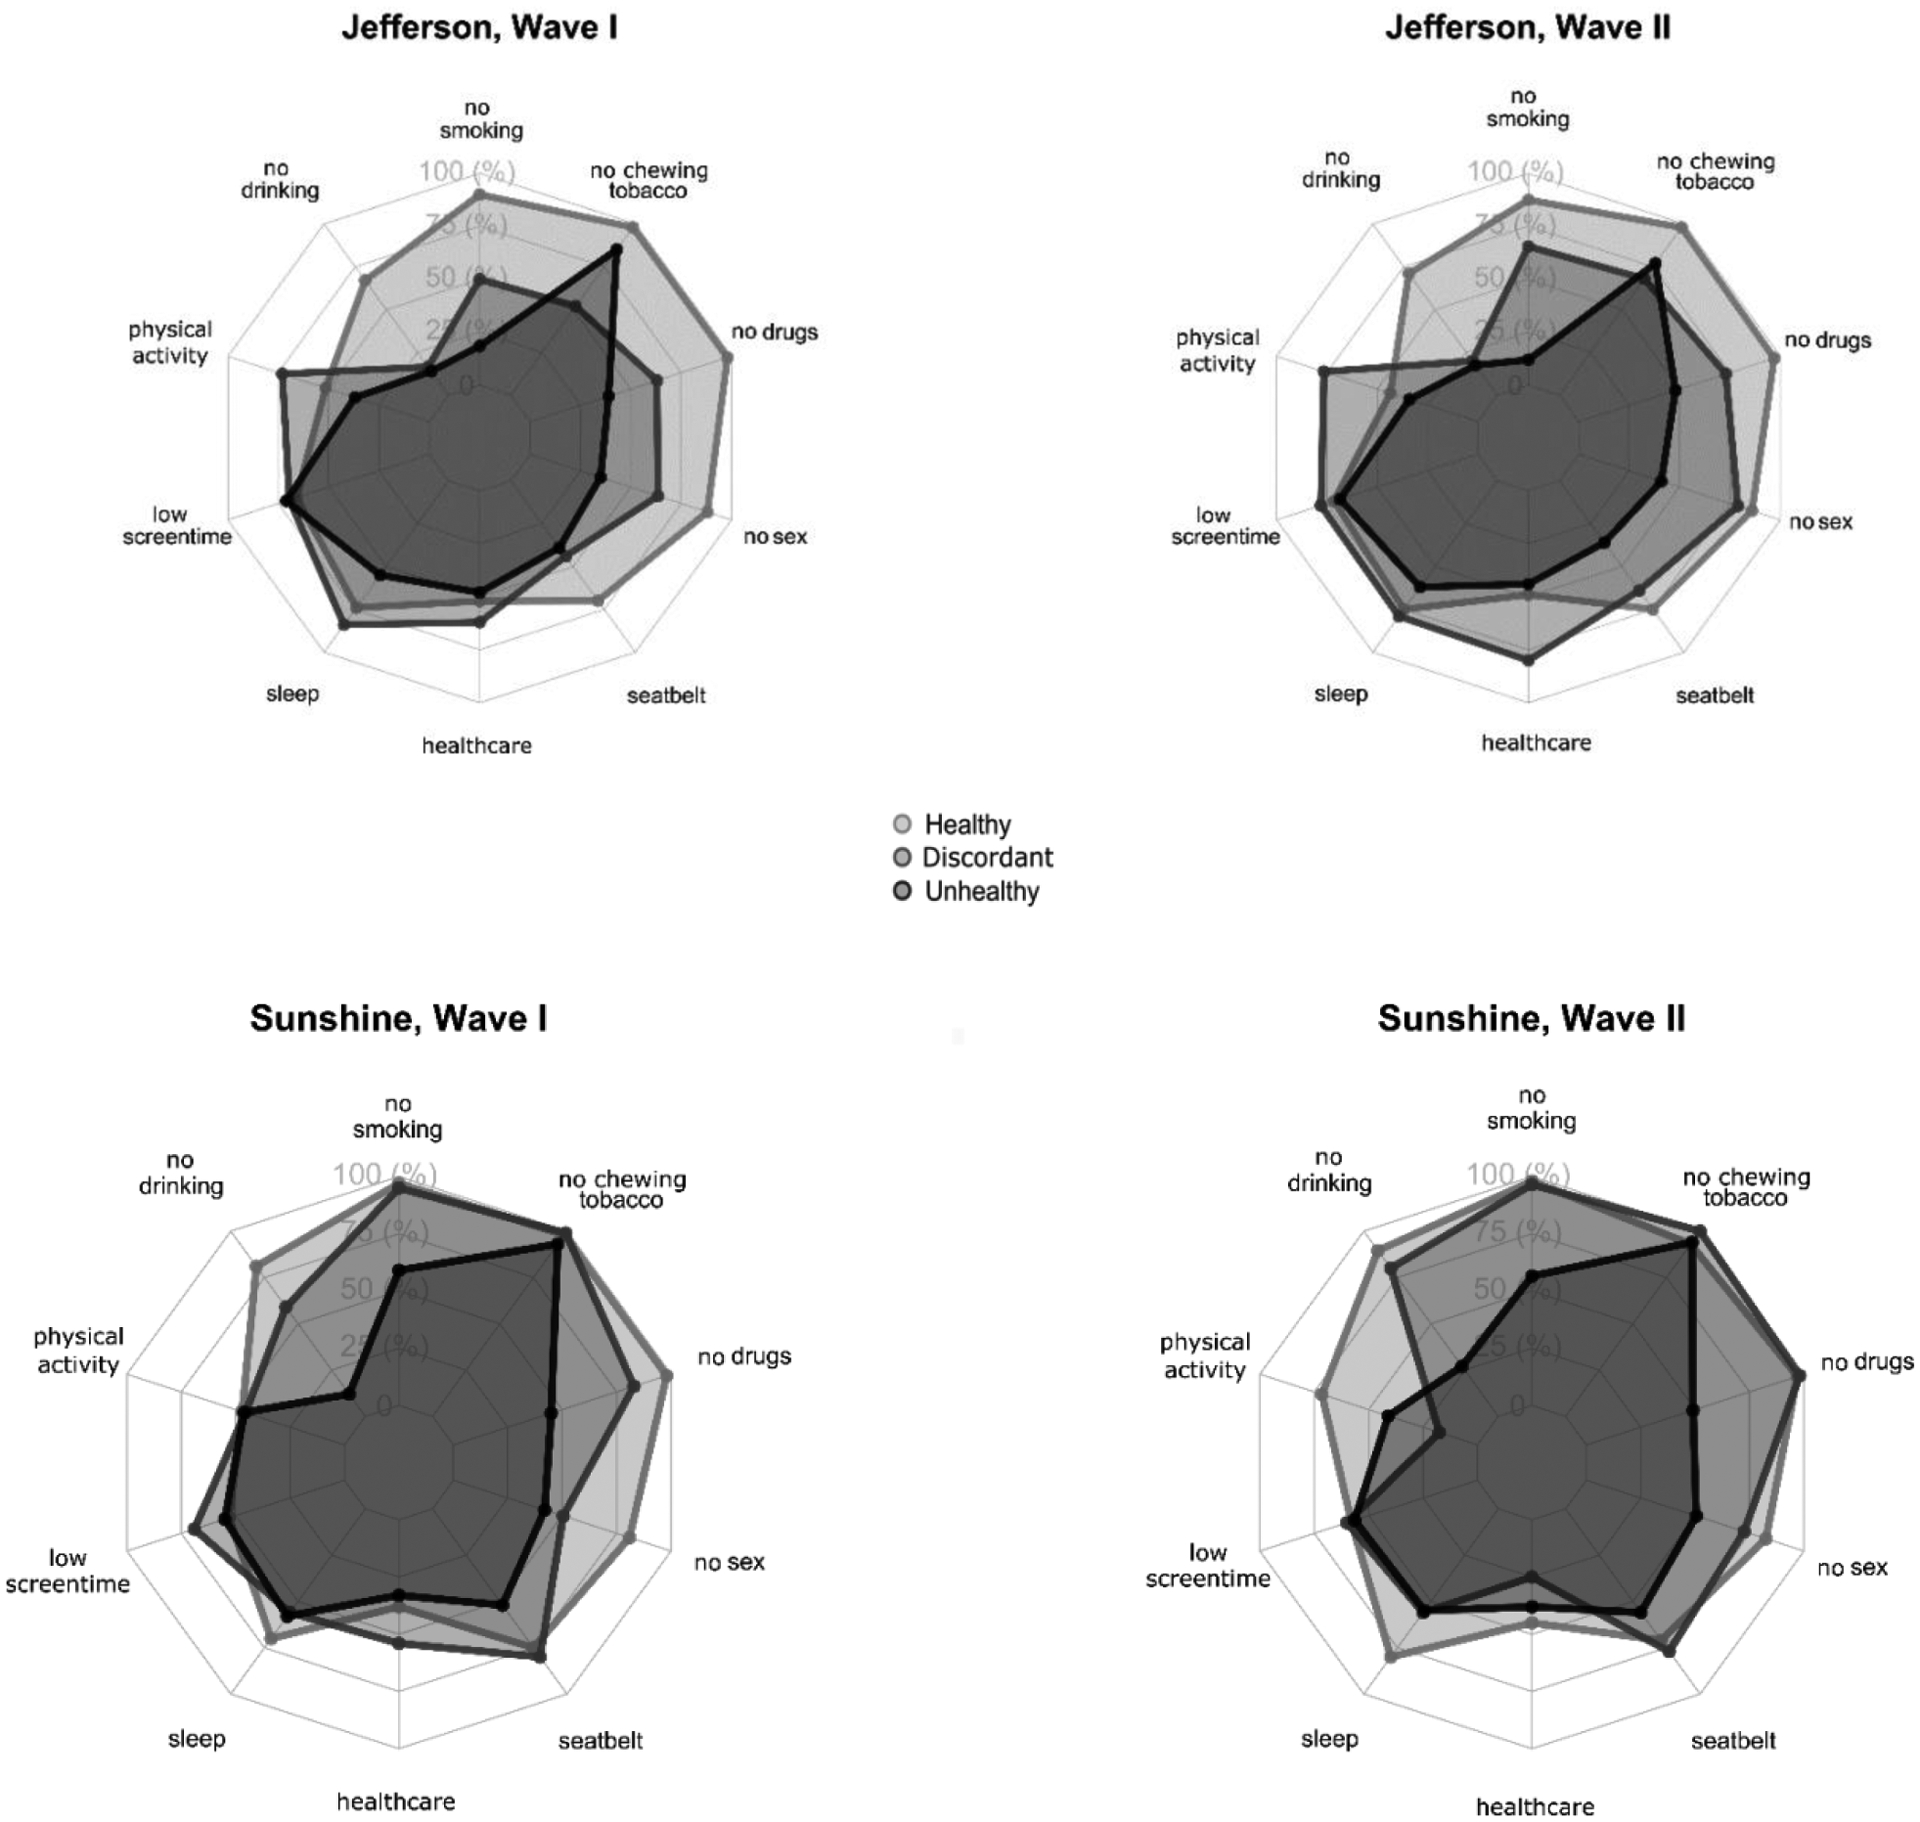
Figure 2. Class-Conditional Response Probabilities from LCA, by School and Wave.

NOTES: The categorical response probabilities were re-scaled to a uniform 0–1 scale, with zero representing the lowest possible value, and 1 the highest for each variable (see details in Appendix Table A2). For trichotomous variables, this required multiplying the category-specific response probabilities by a scaling factor (0 for lowest category, 0.5 for moderate, and 1 for the highest). These then essentially reflect the class-conditional likelihood of selecting the highest category for each variable. For the sexual activity variable, the ordering is no sexual activity, condom at last sex, no condom at last sex.
